
Copy and paste the following code for attribution and get our Free License. Don’t want to provide attribution? Go Premium for more usage rights without attribution!
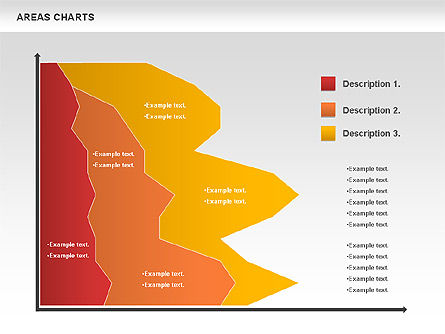
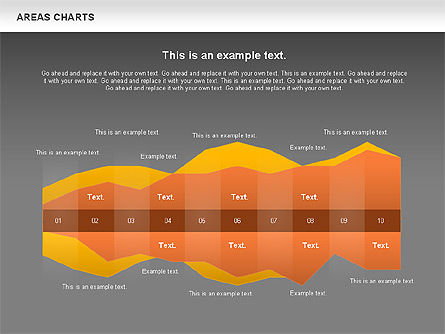
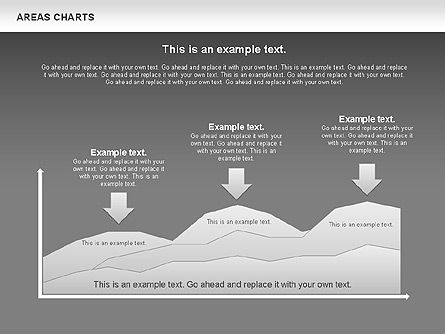
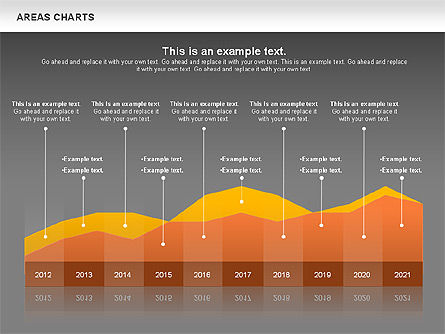


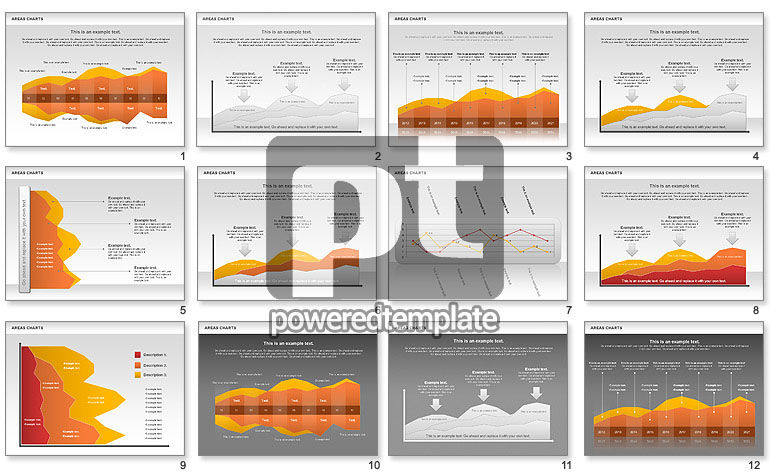
Area Chart (for PowerPoint and Google Slides)

- PowerPoint Template
- 12 Slides
- 4:3
Unlock this file and gain access to other Premium resources.
Go Premium and Download! | Already Premium? Sign in
- PowerPoint Template
- 12 Slides
- 4:3
Unlock this file and gain access to other Premium resources.
Go Premium and Download! | Already Premium? Sign in
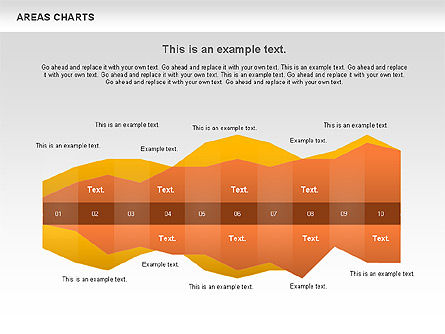
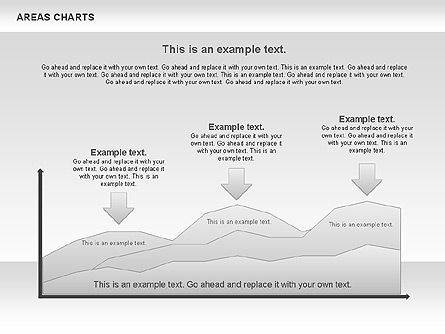
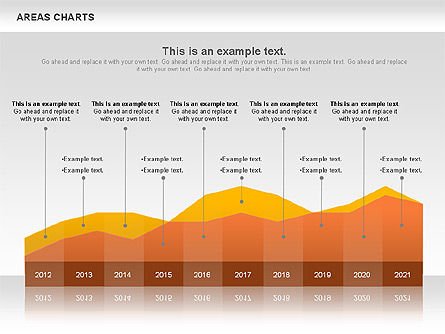
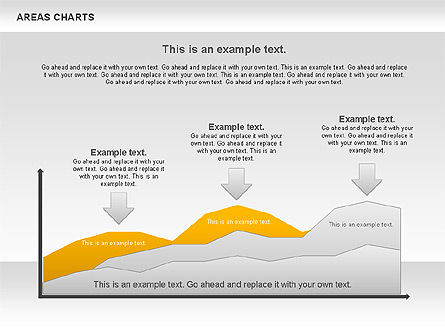
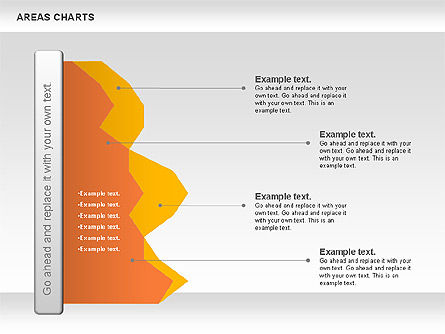
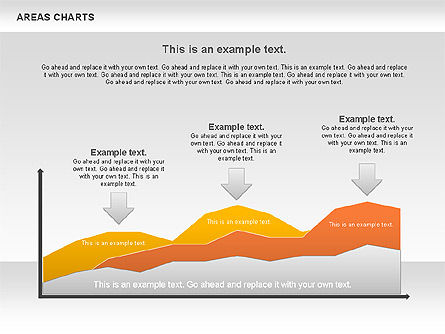
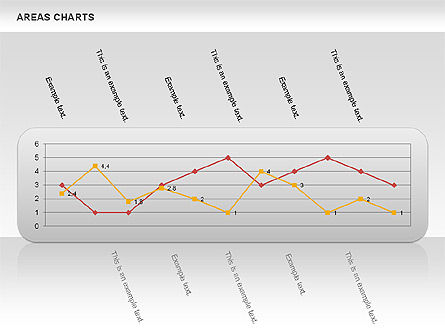
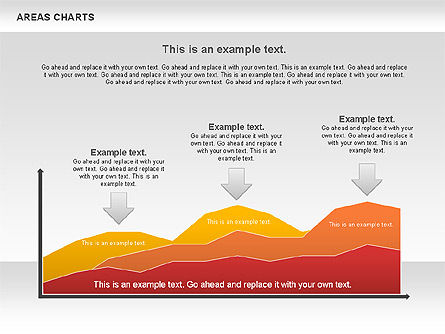
Area Chart is the type of presentation graphic that emphasizes a change in values by filling in the portion of the graph beneath the line connecting various data points. Area charts are used to represent cumulated totals using numbers or percentages (stacked area charts in this case) over time. Will be good choice for presentations on business processes, marketing research, risk evaluation, etc. Download Free Samples. Charts and Diagrams Features.More...
FAQs
The download button isn’t working
Most web browsers have pop-up blockers that may prevent the download window from opening. To resolve this issue, please check your browser settings and allow pop-ups for our website.
For step-by-step instructions, click here.
How can I find my download?
After downloading, you can quickly locate the file by pressing Ctrl + J (or Command + J on Mac) in your web browser. This will open your Downloads list. Look for the file with a “.zip” extension. Click it to open or locate it in your Downloads folder.
Once found, extract the contents to your computer. You can then open the files using compatible software like Microsoft PowerPoint or Microsoft Word.
If you’re downloading directly to Google Drive and can’t find the file, please refer to this guide for troubleshooting steps.
How can I unzip product files?
- Windows: To extract a single file or folder, double-click the compressed folder to open it. Then, drag the file or folder from the compressed folder to a new location. To extract the entire contents of the compressed folder, right-click the folder, click Extract All, and then follow the instructions.
- Mac: Double-click the .zip file, then search for the product folder or product file.
If you continue to have trouble, check out this help article for more tips.
Why aren’t the images from the preview included?
The images shown in the preview are for demonstration purposes only and are not included in the downloadable file due to licensing restrictions.
You can easily replace them with your own visuals or use free stock photos from websites like PoweredTemplate, Unsplash, Pexels, or Pixabay.
How do I provide attribution?
If you’re using a free template with a free account, attribution is required. It’s a simple way to credit the creators for their work. You can add a line like: “Designed by PoweredTemplate”. This credit can be placed on your final product, whether it’s a digital presentation, website, or printed material.
If you have a Premium subscription , you may use our templates without attribution.
For full details on how, when, and where to provide attribution, click here.
Can I order customization services?
PoweredTemplate does not offer custom design services. However, you’re welcome to download any of our templates and customize them as much as you need to suit your project.
How do I contact support?
If you have questions about this product, licensing, billing, or anything else, we're here to help! You can reach us through our Live Chat or visit our Help Center for quick answers and support.
Related Items
An error occurred
Something went wrong. That's all we know for the moment.
Please refresh the page and try again. If the problem persists, kindly wait 30-40 minutes before attempting again. We appreciate your patience.