
110457


PDCA Cycle Infographics for Presentation - Free Google Slides theme and PowerPoint template

ID: 11293
Free for personal and commercial use with attribution required.
How to attribute the author?Unlock this file and gain access to other Premium resources.
Go Premium and Download! | Already Premium? Sign in
Free Google Slides Theme and PowerPoint Template
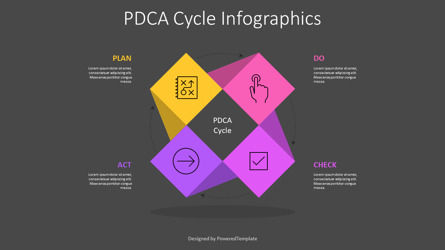
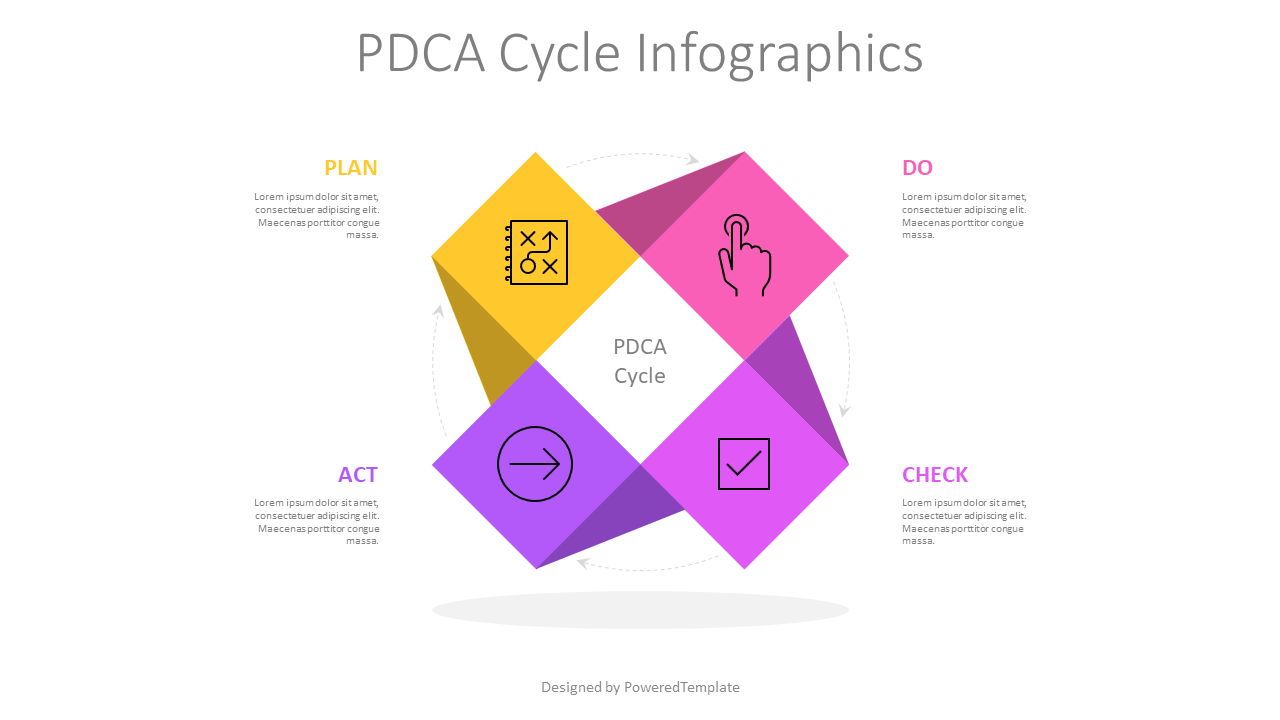
The PDCA Cycle Infographics template is a visually appealing and dynamic design that is perfect for presenting information about the Plan-Do-Check-Act (PDCA) cycle. The template is available in PowerPoint and Google Slides, making it accessible to a wide range of users.The free presentation template features a plus shape formed by 4 colored squares with corresponding icons in the center of each square. The squares have dark triangles that give a dynamic rotation effect, and curved arrows connect them. The template's flat design style and bright colors make it an eye-catching choice for presenting the PDCA Cycle.
The PDCA Cycle is a framework that is used for continuous improvement in various industries. It is a four-step model that helps organizations to continuously improve processes, products, and services. The PDCA Cycle was first introduced by Dr. W. Edwards Deming, who is considered the father of modern quality management.
The 4 steps of the PDCA Cycle are as follows:
- 1. Plan: This step involves identifying a problem or an opportunity for improvement and developing a plan to address it. The plan should include goals, objectives, and a timeline for implementation.
- 2. Do: This step involves implementing the plan and taking action to address the problem or opportunity for improvement. This may involve testing, experimenting, or piloting new processes or procedures.
- 3. Check: This step involves monitoring and evaluating the results of the implementation. It is important to measure the effectiveness of the new process or procedure against the goals and objectives established in the planning phase.
- 4. Act: This step involves taking action based on the results of the evaluation. If the results are positive, the new process or procedure may be standardized and implemented more widely. If the results are negative, changes may be made to the plan and the cycle repeated.
The PDCA Cycle Infographics template can be used by individuals, teams, or organizations who want to present information about the PDCA Cycle. It is ideal for use in presentations, reports, and training sessions.
Overall, the PDCA Cycle Infographics template is an excellent choice for anyone looking for a visually appealing and dynamic way to present information about the PDCA Cycle. Its flat design style and bright colors make it an engaging and professional choice that is sure to impress audiences.
Template Features:
- - 100% editable and easy to modify
- - 2 dark and light slides to impress your audience
- - Contains easy-to-edit graphics
- - Designed to be used in Google Slides and Microsoft PowerPoint
- - PPT / PPTX format file
- - 16:9 widescreen format suitable for all types of screens
- - Includes information about fonts, colors, and credits of the free resources used.
Related Items
An error occurred
Something went wrong. That's all we know for the moment.
Please refresh the page and try again. If the problem persists, kindly wait 30-40 minutes before attempting again. We appreciate your patience.