
108326


NOISE Analysis Infographics Template - Google Slides theme and PowerPoint template

ID: 11182
Unlock this file and gain access to other Premium resources.
Go Premium and Download! | Already Premium? Sign in
Unlock this file and gain access to other Premium resources.
Go Premium and Download! | Already Premium? Sign in
Premium PowerPoint Template and Google Slides Theme
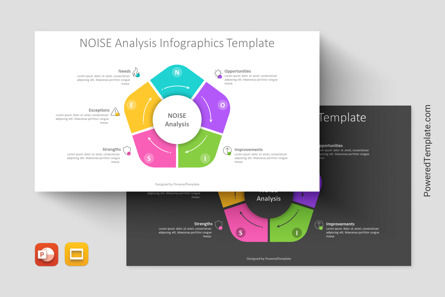
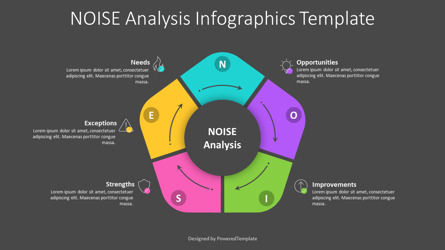
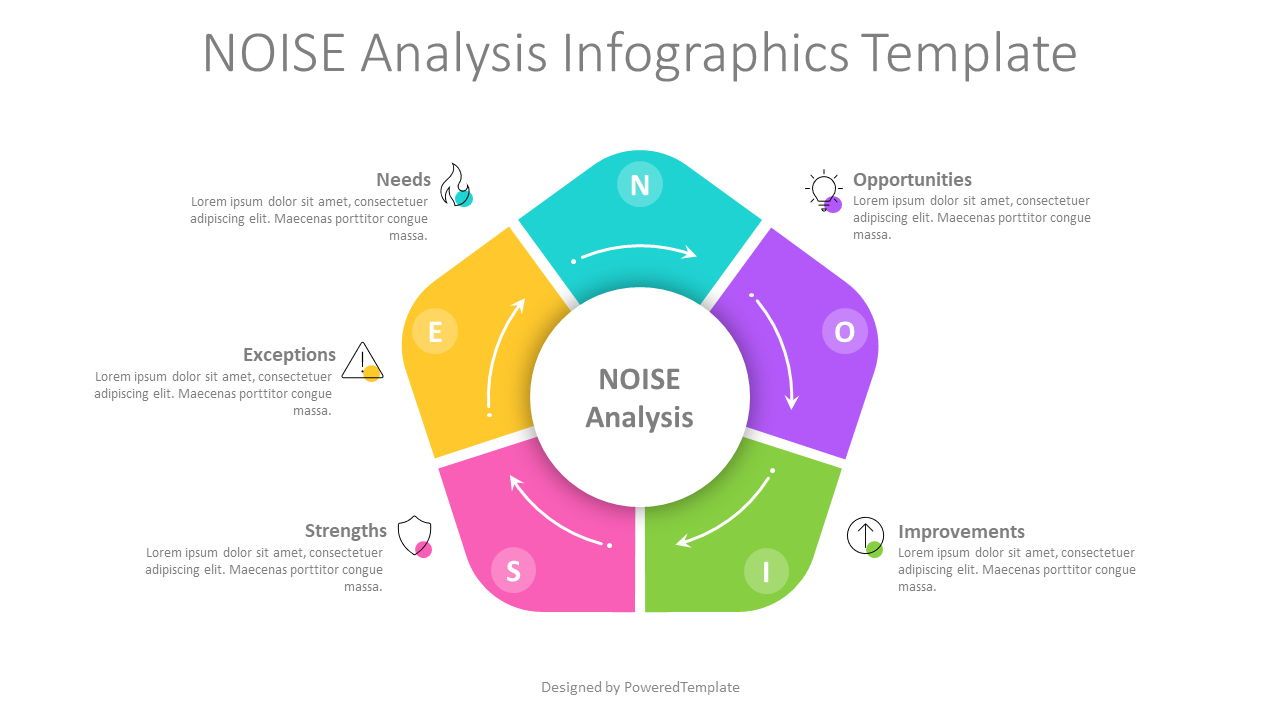
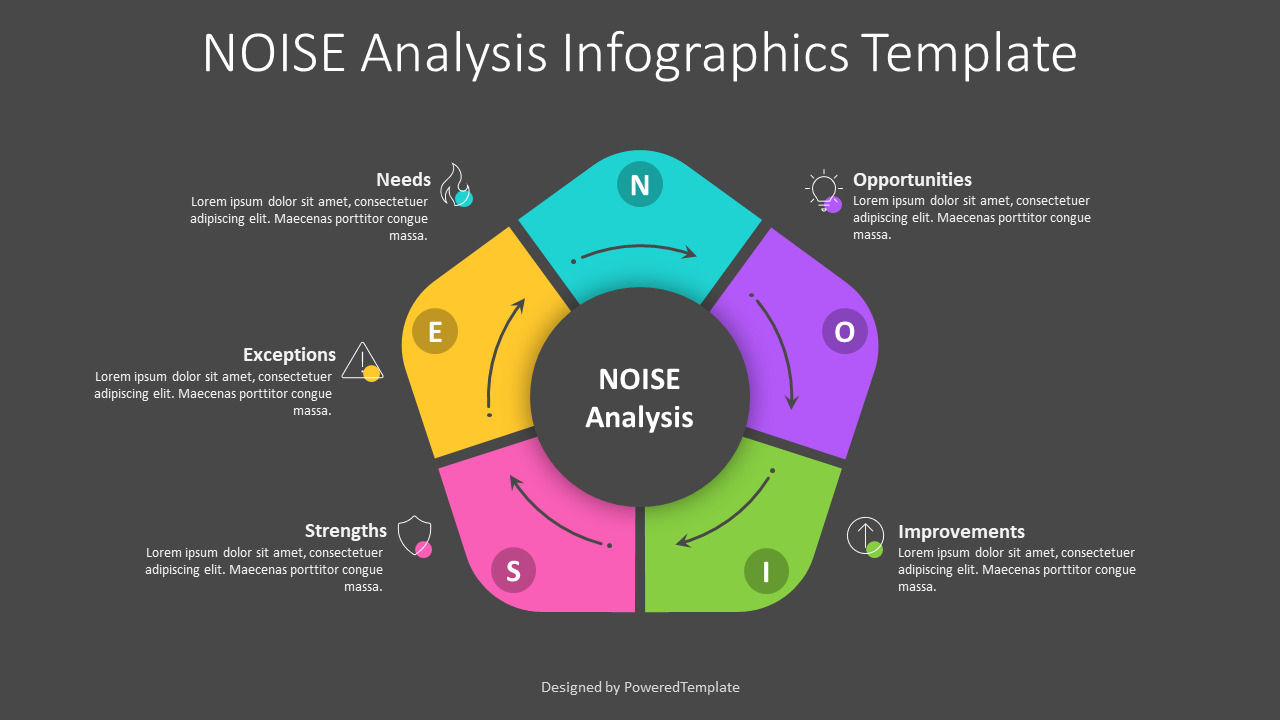
Introducing the NOISE Analysis Infographics Template - the perfect tool for creating engaging and informative presentations. This template is designed to help you visualize the NOISE Analysis process, and present it in a way that is easy to understand and memorable.The presentation template itself is created in a sleek and modern flat design style and consists of a rounded pentagon divided into 5 colored parts, with a circle in the center. A curved arrow is placed around the circle, forming a cycle process, which is a great way to convey the idea of a continuous improvement process. Each colored part has a letter: N, O, I, S, and E, representing the different aspects of the NOISE Analysis process.
Let's take a closer look at each part of the template. The first part is the Needs section, which is represented by the letter "N" and a corresponding icon. This section is all about identifying the needs of your organization or project, and understanding what is required to achieve success. The Opportunities section, represented by the letter "O" and a corresponding icon, is about identifying opportunities for growth and improvement.
The Improvements section, represented by the letter "I" and a corresponding icon, is about identifying areas where improvements can be made to the current processes, systems, or products. The Strengths section, represented by the letter "S" and a corresponding icon, is about identifying the strengths of the organization or project, and leveraging those strengths to achieve success.
Finally, the Exceptions section, represented by the letter "E" and a corresponding icon, is about identifying any exceptions to the rules or processes that need to be taken into consideration. The circle in the center of the template represents Expectations, which is the ultimate goal of the NOISE Analysis process.
NOISE Analysis is a powerful tool that can be used to drive continuous improvement in any organization or project. By analyzing the Needs, Opportunities, Improvements, Strengths, and Exceptions, you can identify areas for improvement and take action to achieve success.
This template can be used by anyone who wants to create a compelling and informative presentation on the NOISE Analysis process. It is particularly useful for project managers, business analysts, and other professionals who are involved in continuous improvement initiatives. The template is compatible with both PowerPoint and Google Slides, making it easy to customize and use for any presentation. So why wait? Download the NOISE Analysis Infographics Template today and take your presentations to the next level!
Template Features:
- - 100% editable and easy to modify
- - 2 dark and light slides to impress your audience
- - Contains easy-to-edit graphics
- - Designed to be used in Google Slides and Microsoft PowerPoint
- - PPT / PPTX format file
- - 16:9 widescreen format suitable for all types of screens
- - Includes information about fonts, colors, and credits of the free resources used.
Related Items