
99335


Manufacturing Performance Metrics Onion Diagram for Presentations - Free Google Slides theme and PowerPoint template

ID: 10752
Free for personal and commercial use with attribution required.
How to attribute the author?Unlock this file and gain access to other Premium resources.
Go Premium and Download! | Already Premium? Sign in
Free Google Slides theme and PowerPoint template
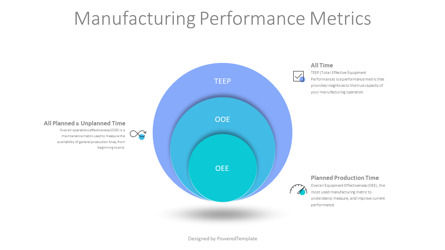
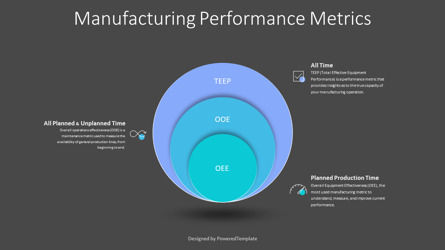
If you're looking to make a persuasive presentation on the performance of your manufacturing company, a Manufacturing Performance Metrics Onion Diagram is just the template you need! This free presentation template shows a volumetric 3-level onion diagram and provides a visual representation of how overall equipment effectiveness (OEE), overall operating efficiency (OOE), and total effective equipment performance (TEEP) contribute to overall production output.When evaluating the performance of a manufacturing operation, there are 3 key metrics to consider: productivity, cost control, and quality. Productivity measures how efficiently inputs such as labor, materials, and energy are utilized in a production process. It is the ratio of output over input. Cost control centers on expenses and profits generated by an operation - it looks at expenses related to labor, materials, utilities, and other overhead costs associated with production. Quality assesses the consistency of products or services delivered to customers. Typically this includes measuring how well the product meets customer requirements from the point of order fulfillment through the delivery of goods. By understanding these 3 primary performance metrics, operations can be managed in ways that maximize output rate efficiency for long-term success.
Simply download this free diagram template and customize it with your own data; it's bound to wow your audience! It's incredibly easy to use with both PowerPoint and Google Slides.
Focus on what matters most: delivering an excellent presentation that clearly communicates the performance of your manufacturing organization. Make sure you have all the information and data needed when you create your onion diagram so that you can truly show the strengths and weaknesses of manufacturing operations.
Template Features:
- * 100% editable and easy to modify
- * 2 dark and light slides to impress your audience
- * Contains easy-to-edit graphics
- * Designed to be used in Google Slides and Microsoft PowerPoint
- * PPT/PPTX format file
- * 16:9 widescreen format suitable for all types of screens
- * Includes information about fonts, colors, and credits of the free resources used.
Download Free Samples. Charts and Diagrams Features.More...
Related Items