Free Google Slides Theme and PowerPoint Template
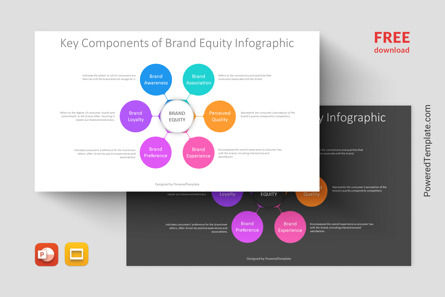
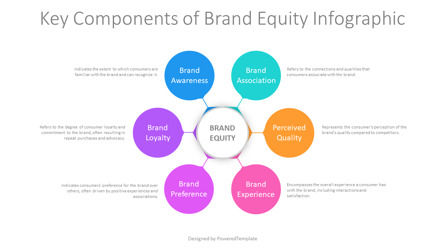
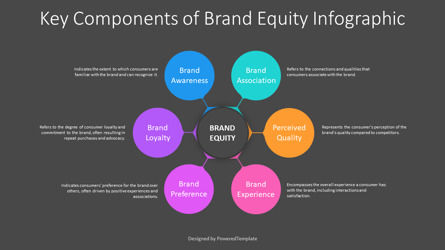
This Key Components of Brand Equity Infographic free presentation template features a colorful, circular infographic design, highlighting the key components of brand equity. The PPT template is available in both light and dark slides and is compatible with Canva, Apple Keynote, PowerPoint, and Google Slides. It showcases a central circle labeled "Brand Equity," surrounded by six interconnected circles representing different elements.
The model represented in this template is the Brand Equity model, which outlines the key components contributing to a brand's overall equity and value:
- • Brand Awareness: Indicates the extent to which consumers are familiar with the brand and can recognize it.
- • Brand Association: Refers to the connections and qualities that consumers associate with the brand.
- • Perceived Quality: Represents the consumer’s perception of the brand’s quality compared to competitors.
- • Brand Experience: Encompasses the overall experience a consumer has with the brand, including interactions and satisfaction.
- • Brand Preference: Indicates consumers' preference for the brand over others, often driven by positive experiences and associations.
- • Brand Loyalty: Refers to the degree of consumer loyalty and commitment to the brand, often resulting in repeat purchases and advocacy.
The target audience for this template includes marketing professionals, brand managers, business strategists, and educators who are looking to explain or understand the components of brand equity in a visually engaging manner.
Download this comprehensive Brand Equity Presentation Template for free and enhance your presentations with visually appealing and informative slides.
Key Components of Brand Equity Infographic Presentation Template Features:
- - 100% editable and easy to modify
- - Contains easy-to-edit graphics
- - 2 dark and light slides to impress your audience
- - Designed to be used in Canva, Apple Keynote, Google Slides, and MS PowerPoint
- - PPT / PPTX format file ready for instant download
- - 16:9 widescreen format suitable for all types of screens
- - Includes information about fonts, colors, and credits of the free resources used.


