
111242


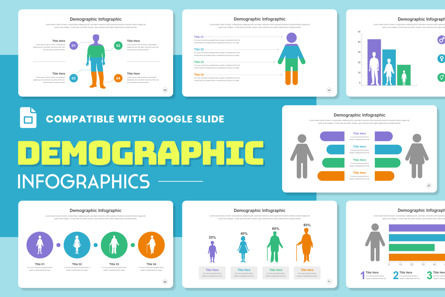
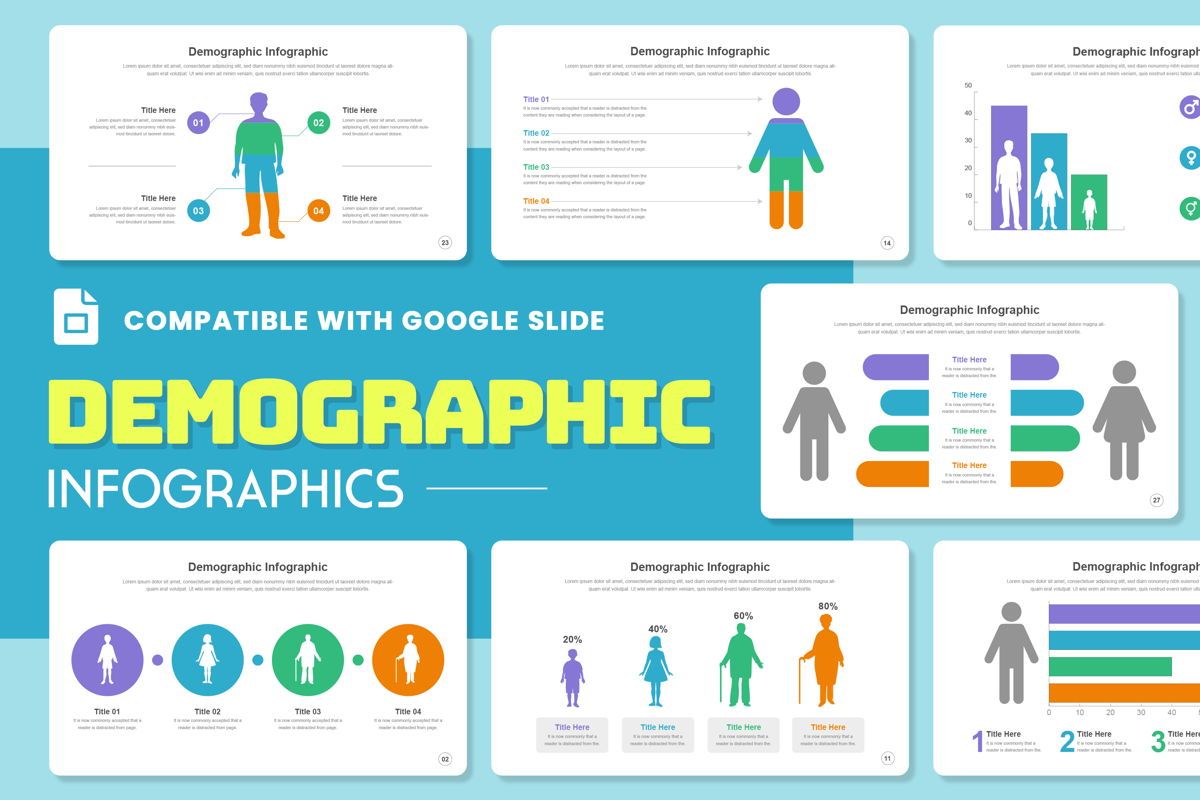
Demographic Infographic Google Slide

ID: 11399
Unlock this file and gain access to other Premium resources.
Go Premium and Download! | Already Premium? Sign in
Unlock this file and gain access to other Premium resources.
Go Premium and Download! | Already Premium? Sign in
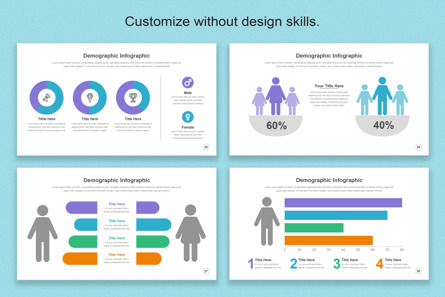
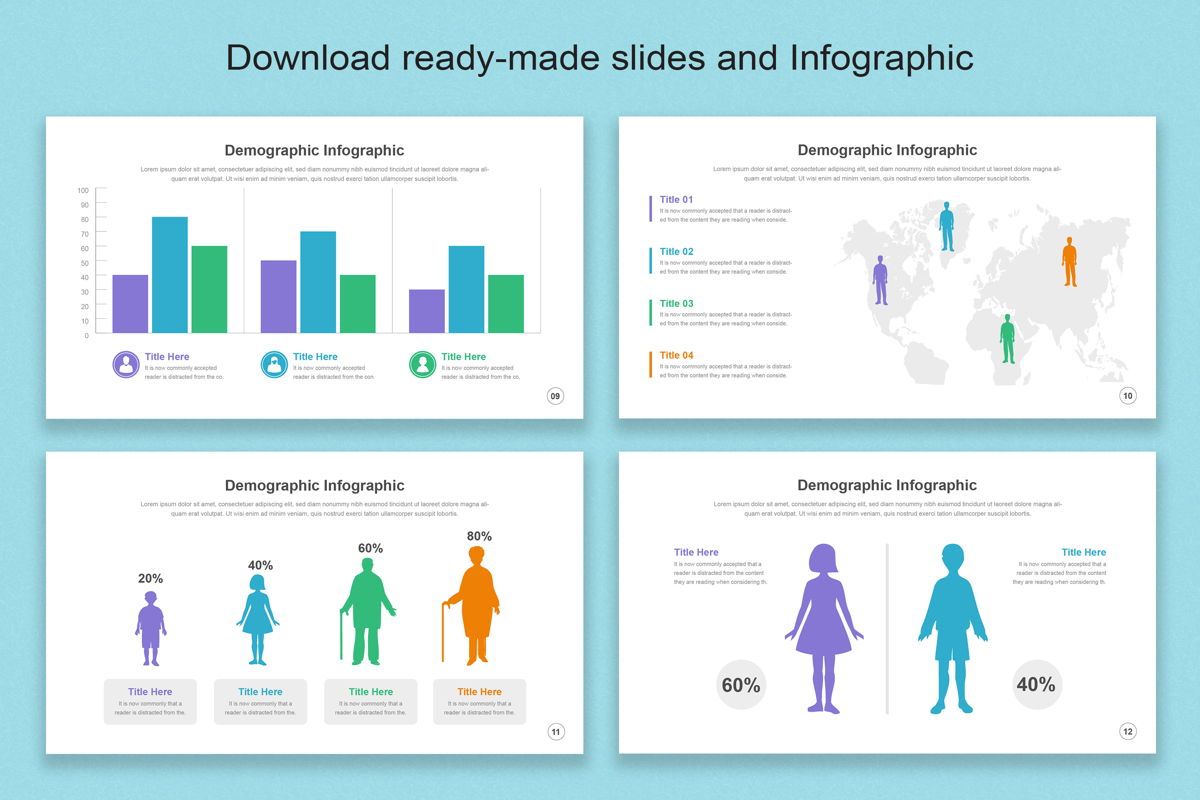
Looking for a way to visually represent your findings from your research? Look no further than our Demographic Infographic Templates. With multiple options to choose from, you’ll be sure to find the perfect one for your project. These infographics are a great way to represent your findings in a visual way. They can be used by anyone who is researching the current status of the population. So whether you’re a company looking to determine the size of your potential market or a person doing research on the current status of the population, these infographics are the perfect choice.
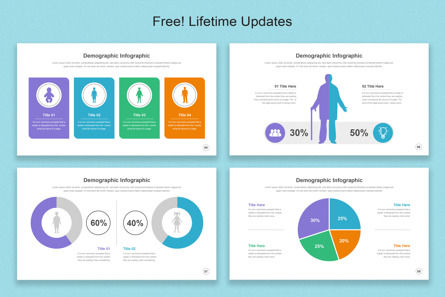
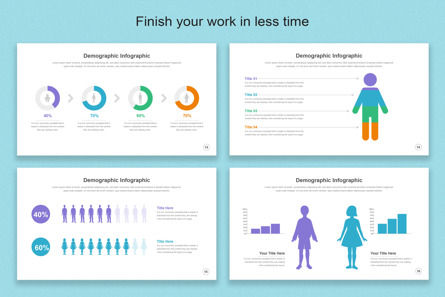
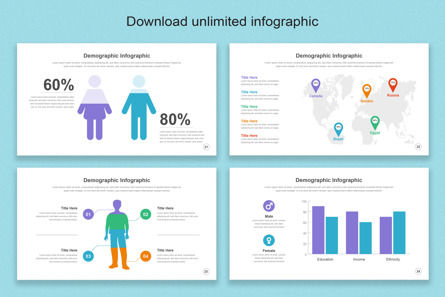
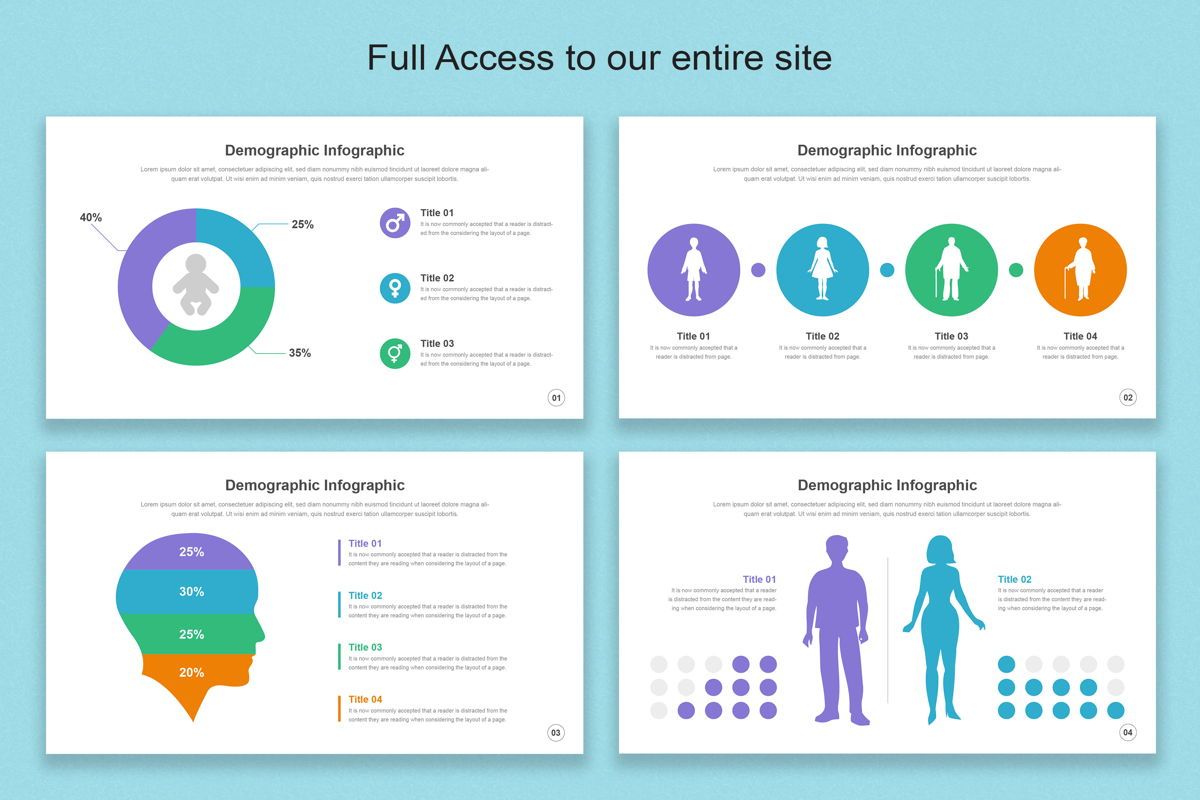
Demographic infographics are a great way to represent your findings in a visual way. With multiple infographics to choose from, you’ll be sure to find the correct one for your project. Segmenting a population by using demographics allows companies to determine the size of a potential market. The use of demographics helps to determine whether its products and services are being targeted to that company’s most important consumers. Our demographic infographics are a perfect way to represent your findings in a visual way.
▶ F E A T U R E
================
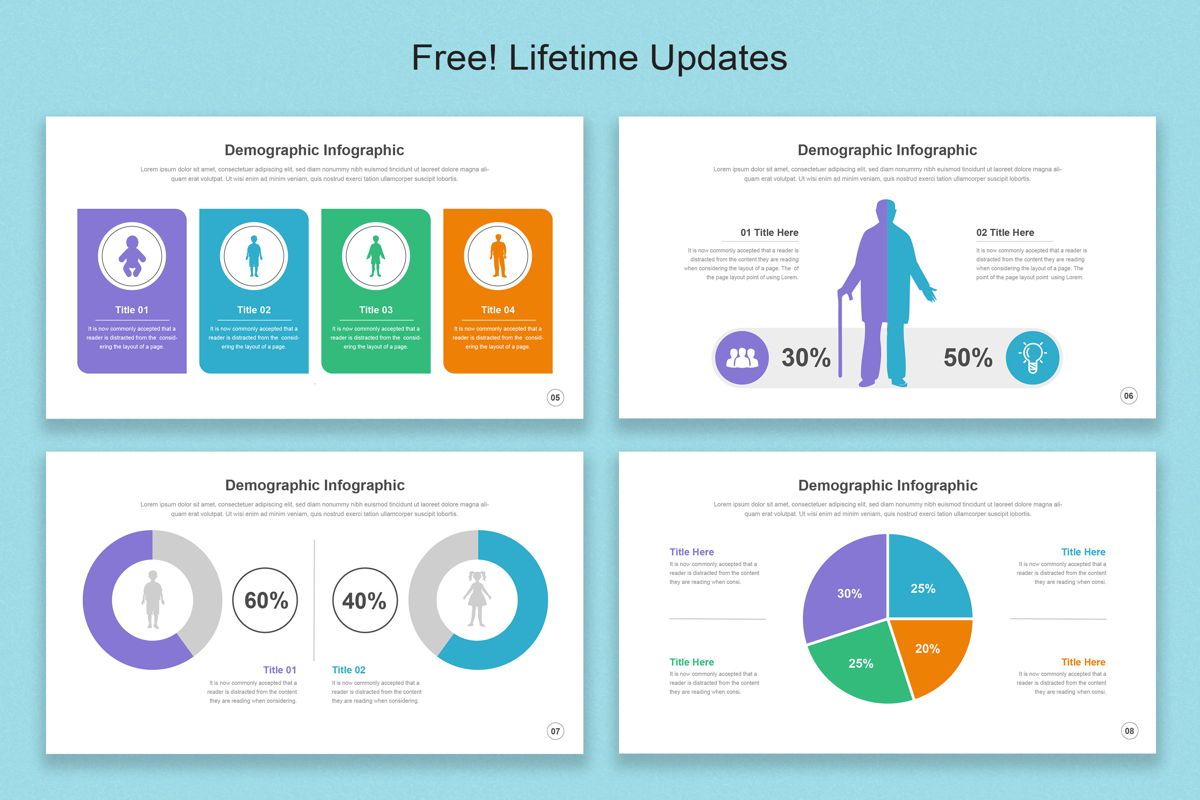
✔ Instant Download – your files are available immediately after purchase
✔ Professional, clean design
✔ Easy to edit in Apple Keynote File
✔ 100% Editable
✔ Using a free font
▶ W H A T ' S I N S I D E
===========================
✔ Google Slides
✔ Help File Documentation
✔ Links to free fonts used
✔ Fast and friendly customer service for any help you may need
▶ S U P P O R T
================
For any help regarding this file, please feel free to contact me and I’ll be glad to offer support. If you have a moment, please rate this item, I’ll appreciate it very much! Please don’t underestimate the power of the stars.
THANK YOU. More...
Demographic infographics are a great way to represent your findings in a visual way. With multiple infographics to choose from, you’ll be sure to find the correct one for your project. Segmenting a population by using demographics allows companies to determine the size of a potential market. The use of demographics helps to determine whether its products and services are being targeted to that company’s most important consumers. Our demographic infographics are a perfect way to represent your findings in a visual way.
▶ F E A T U R E
================
✔ Instant Download – your files are available immediately after purchase
✔ Professional, clean design
✔ Easy to edit in Apple Keynote File
✔ 100% Editable
✔ Using a free font
▶ W H A T ' S I N S I D E
===========================
✔ Google Slides
✔ Help File Documentation
✔ Links to free fonts used
✔ Fast and friendly customer service for any help you may need
▶ S U P P O R T
================
For any help regarding this file, please feel free to contact me and I’ll be glad to offer support. If you have a moment, please rate this item, I’ll appreciate it very much! Please don’t underestimate the power of the stars.
THANK YOU. More...
More Products by MightySlide
Related Items