


BIM Lifecycle Knowledge Mapping Diagram for Presentations - Google Slides theme and PowerPoint template

Unlock this file and gain access to other Premium resources.
Go Premium and Download! | Already Premium? Sign in
Unlock this file and gain access to other Premium resources.
Go Premium and Download! | Already Premium? Sign in
Premium PowerPoint Template and Google Slides Theme
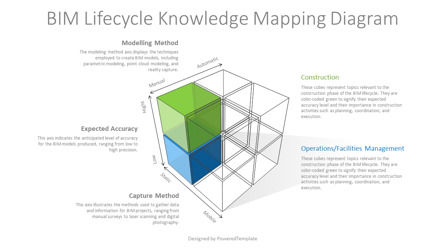
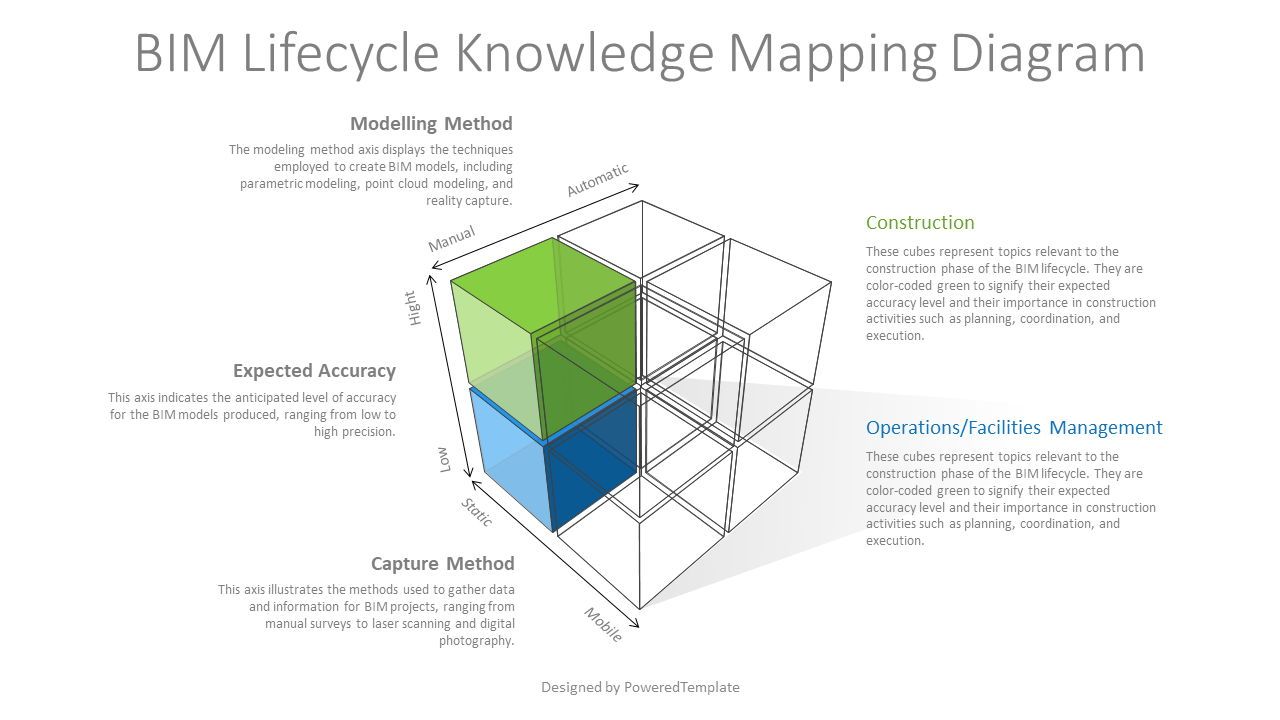
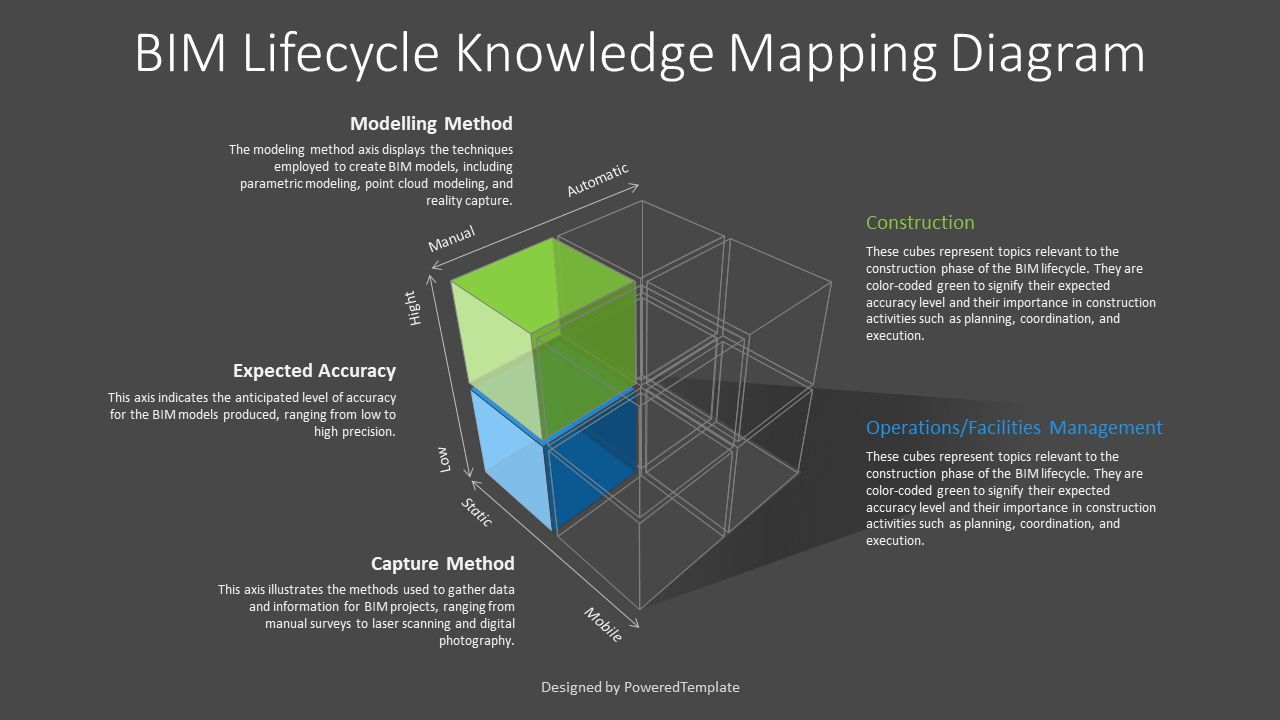
Introducing our premium BIM Lifecycle Knowledge Mapping Diagram Presentation Template, meticulously designed to enhance your presentations on Building Information Modeling (BIM) lifecycle strategies. At the core of this template is a three-dimensional cube, representing the multifaceted nature of BIM knowledge mapping. The cube is defined by three axes: Capture Method, Modelling Method, and Expected Accuracy. Two filled color cubes signify topics under investigation, providing a visual representation of ongoing research or analysis. Expected accuracy is color-coded to indicate typical BIM lifecycle uses: blue for operations/facilities management and green for construction. This visually engaging design facilitates comprehensive understanding and strategic decision-making in BIM implementation.
The BIM Lifecycle Knowledge Mapping Diagram provides a visual representation of knowledge capture, modeling methods, and expected accuracy within the Building Information Modeling (BIM) lifecycle. It is a strategic tool used to map and analyze knowledge across the lifecycle of a building project. Along each axis, the diagram showcases different aspects:
- 1. Capture Method: This axis represents the methods used to capture and collect data throughout the project lifecycle, such as laser scanning, photogrammetry, or manual measurements.
- 2. Modeling Method: The modelling method axis reflects the techniques and processes used to create digital models of the building project, including Building Information Modeling (BIM), Computer-Aided Design (CAD), and Virtual Design and Construction (VDC).
- 3. Expected Accuracy: This axis indicates the level of accuracy expected from the data and models produced, which varies depending on the stage of the project and the intended use. Blue represents accuracy suitable for operations/facilities management, while green represents accuracy suitable for construction purposes.
Filled color cubes within the diagram represent specific topics or areas under investigation within the BIM lifecycle. The color coding of these cubes reflects their expected accuracy and typical uses within the BIM lifecycle:
- * Blue Cubes (Operations/Facilities Management): These cubes represent topics related to operations and facilities management within the BIM lifecycle. They are typically color-coded blue to indicate their expected accuracy level and their relevance in the post-construction phase for activities such as maintenance, operations, and facility management.
- * Green Cubes (Construction): These cubes represent topics relevant to the construction phase of the BIM lifecycle. They are color-coded green to signify their expected accuracy level and their importance in construction activities such as planning, coordination, and execution.
By visually mapping out the knowledge space in this way, the diagram helps stakeholders understand the different methods of data capture and modeling, as well as the expected accuracy levels associated with various topics within the BIM lifecycle. This facilitates informed decision-making and prioritization of resources based on the specific needs and requirements of BIM projects.
Unlock the potential of BIM lifecycle knowledge mapping and elevate your project outcomes with our premium presentation template. Download now to visualize your BIM strategies, optimize workflows, and drive performance across the building lifecycle. Take the first step towards achieving BIM excellence. Download now!
Template Features:
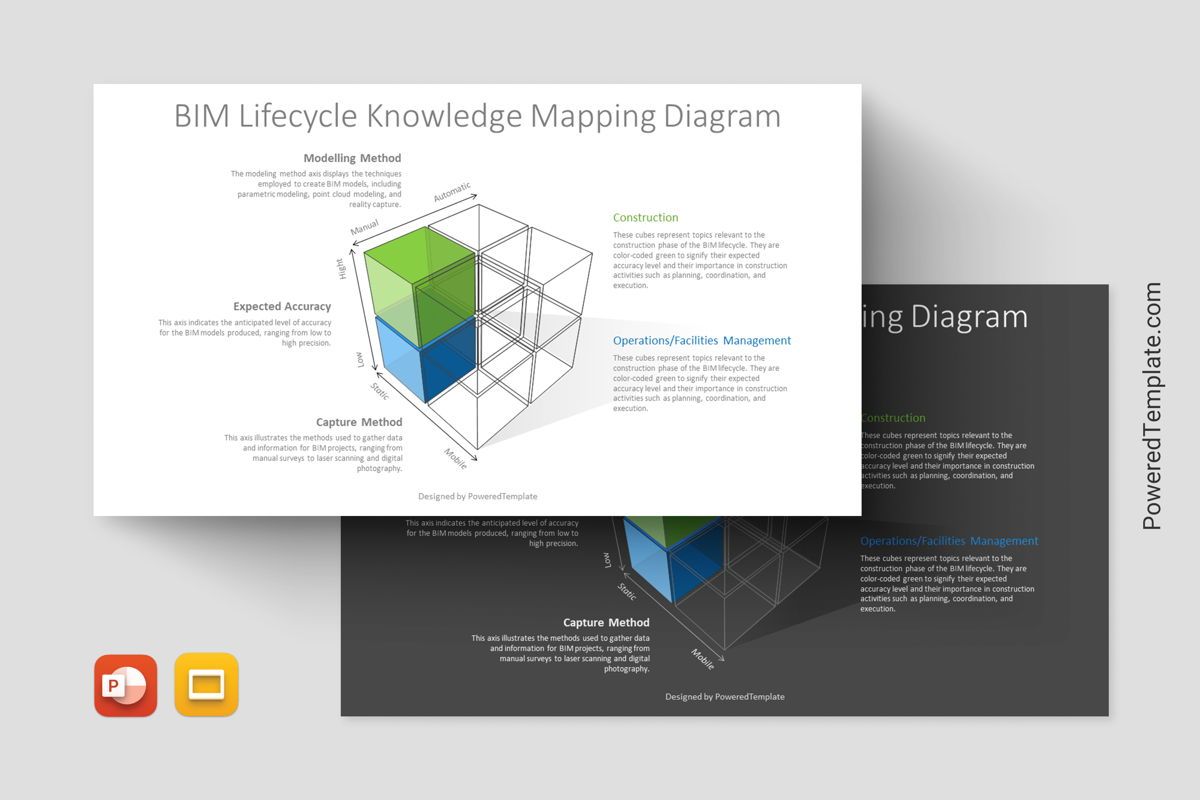
- - 100% editable and easy to modify
- - 2 dark and light slides to impress your audience
- - Designed to be used in Google Slides and MS PowerPoint
- - PPT / PPTX format file ready for instant download
- - 16:9 widescreen format
Related Items
An error occurred
Something went wrong. That's all we know for the moment.
Please refresh the page and try again. If the problem persists, kindly wait 30-40 minutes before attempting again. We appreciate your patience.