
111394


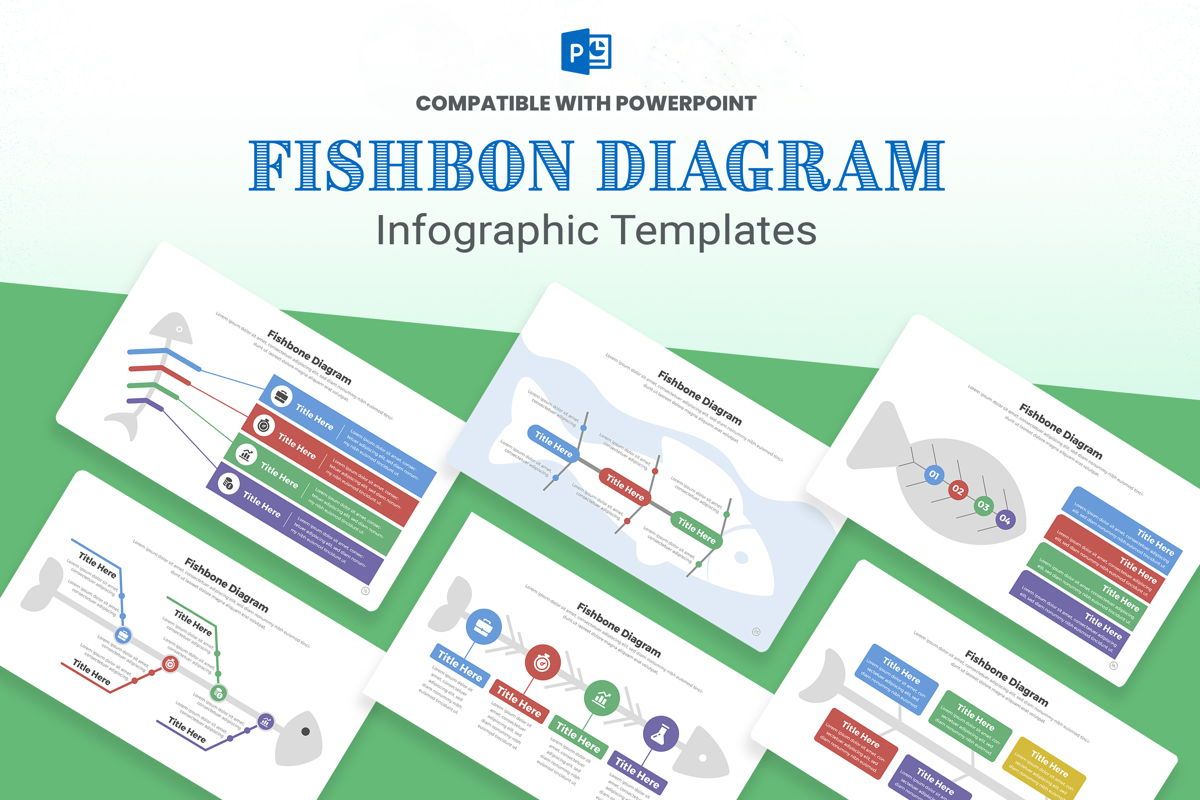
Fishbone Diagram Infographic PowerPoint Template - 파워 포인트 템플릿

ID: 11413
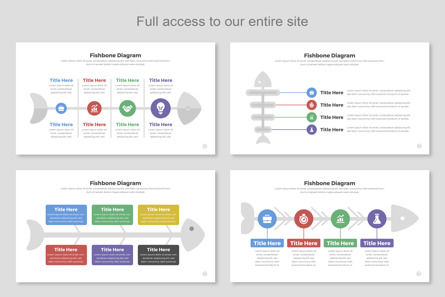
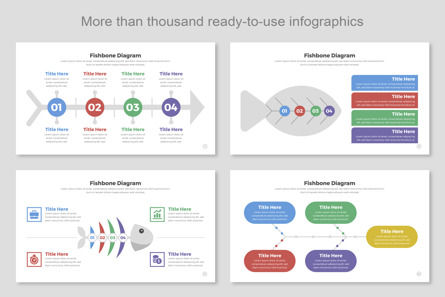
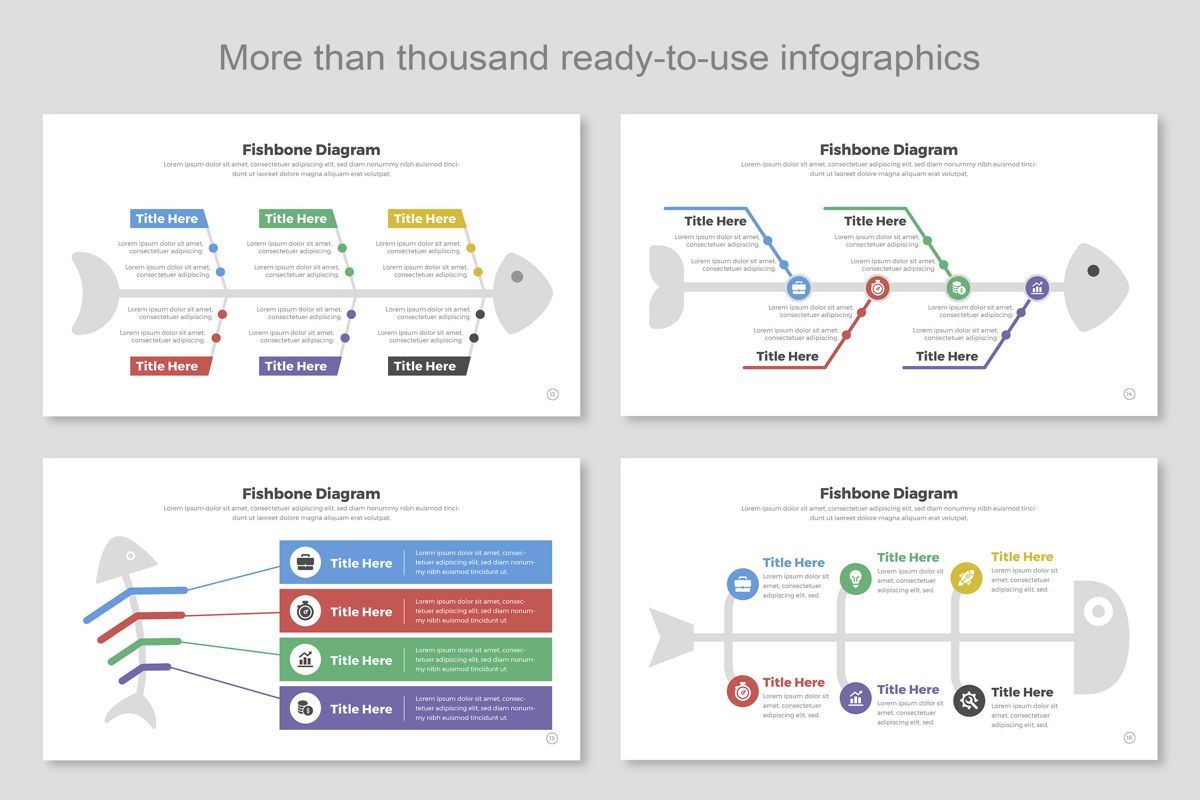
Introducing the comprehensive Fishbone Diagram Infographic Set, designed to help businesses, problem solvers, and professionals effectively analyze and visualize complex issues and their root causes. The fishbone diagram, also known as the Ishikawa diagram or cause-and-effect diagram, is a powerful tool for problem-solving and process improvement. This set of infographics provides a versatile collection of templates that enable you to create visually compelling fishbone diagrams with ease.
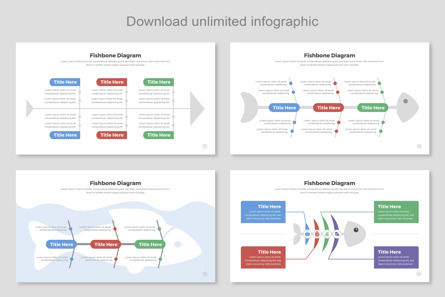
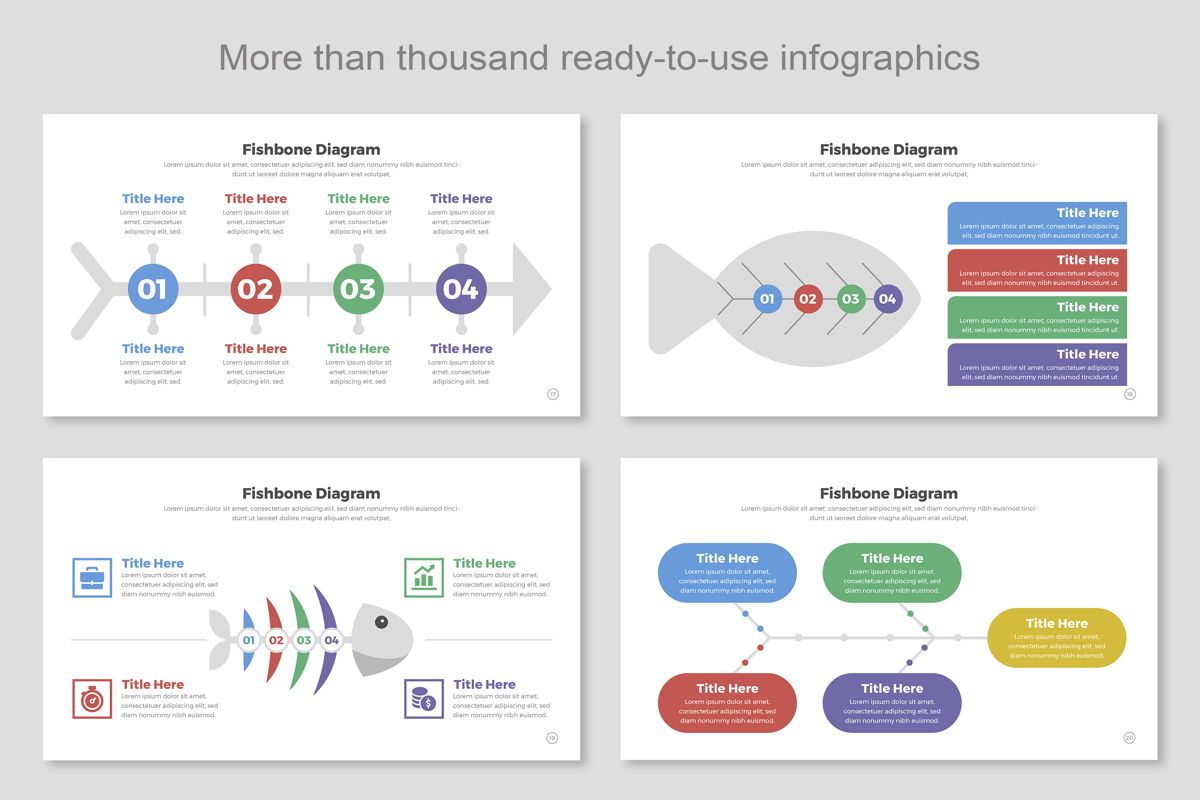
Each template within the Fishbone Diagram Infographic Set offers a visually engaging and intuitive design, allowing you to identify and display the underlying causes contributing to a problem or outcome. With a structured framework and customizable elements, these templates help you systematically explore various categories, such as people, process, environment, equipment, and more, to pinpoint the root causes of issues.
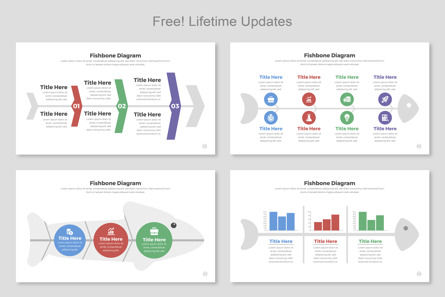
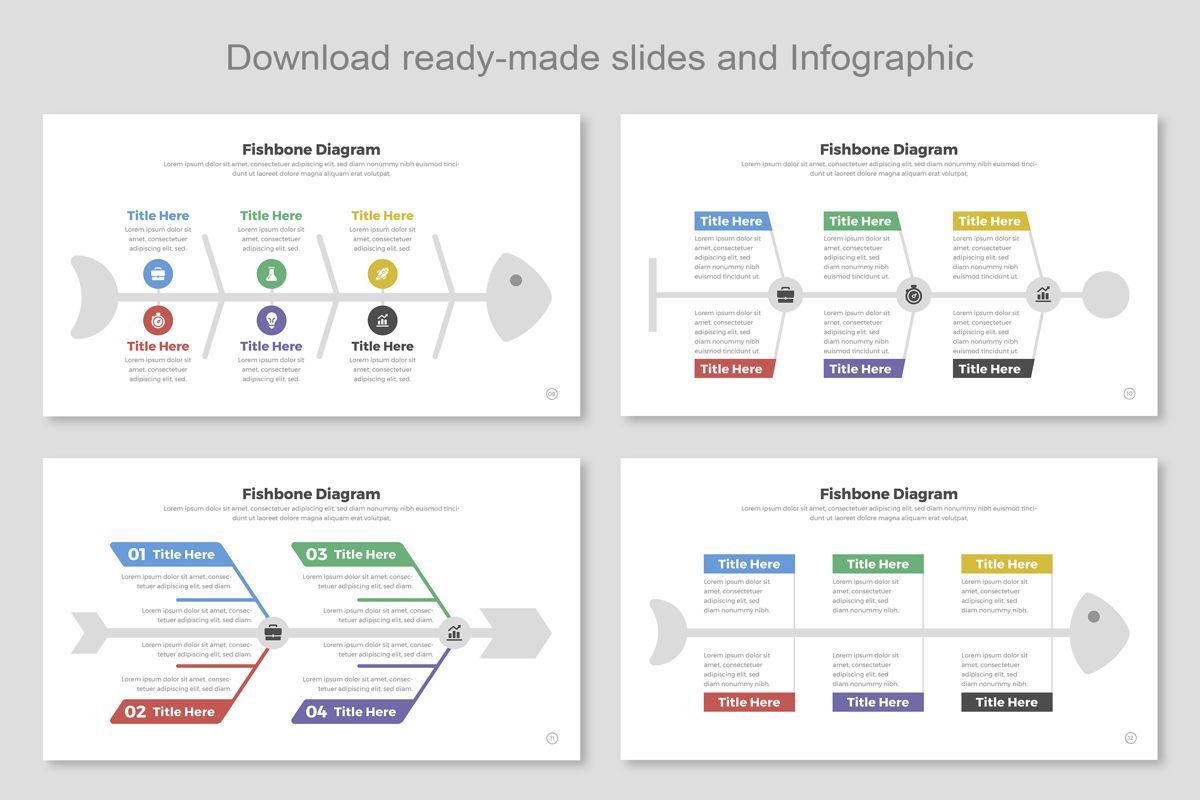
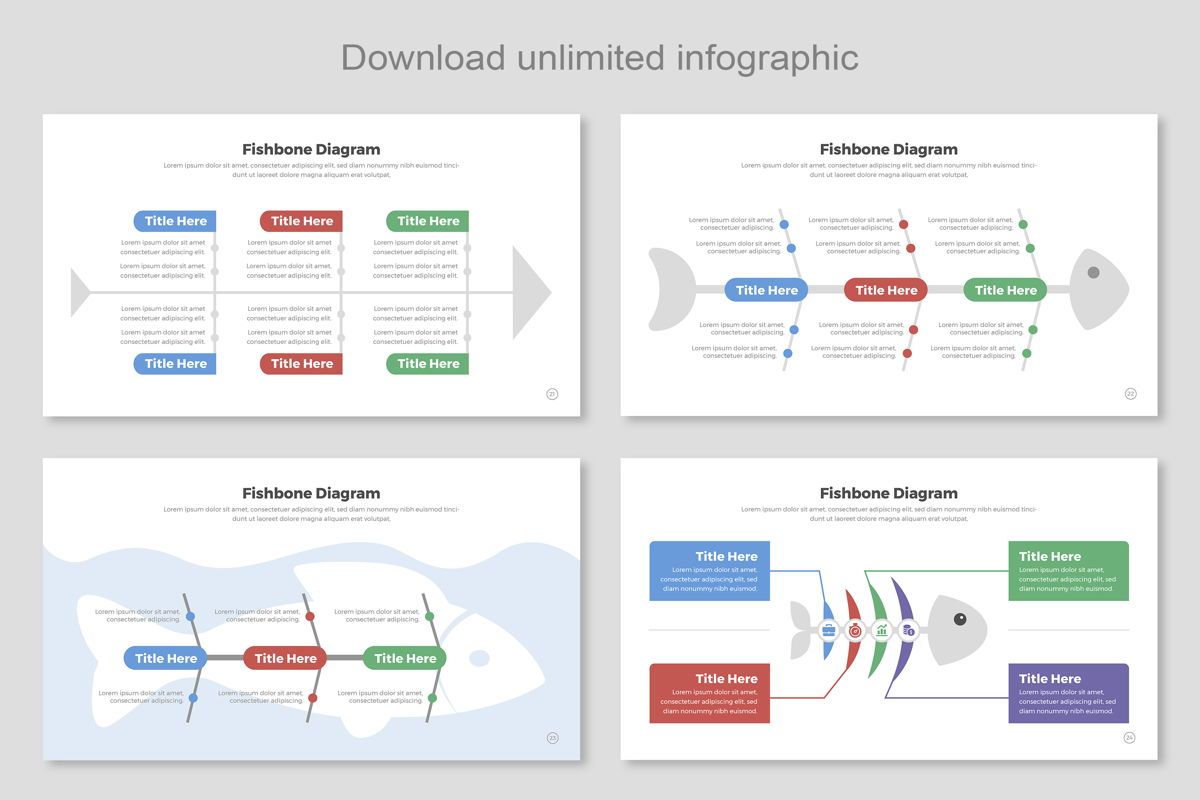
From business analysis and quality management to project planning and problem-solving, the Fishbone Diagram Infographic Set is ideal for a wide range of applications. These templates empower you to present complex information in a clear and concise manner, fostering better understanding and collaboration among team members, stakeholders, and decision-makers.
With easy-to-use customization options, you can tailor each template to suit your specific needs. Modify colors, fonts, and layout elements to align with your branding and data requirements, ensuring a cohesive and professional presentation of your fishbone diagrams.
▶ F E A T U R E
================
✔ Instant Download – your files are available immediately after purchase
✔ Professional, clean design
✔ Easy to edit in PowerPoint File
✔ 100% Editable
✔ Using a free font
▶ W H A T ' S I N S I D E
===========================
✔ PowerPoint File
✔ Help File Documentation
✔ Links to free fonts used
✔ Fast and friendly customer service for any help you may need
▶ S U P P O R T
================
For any help regarding this file, please feel free to contact me and I’ll be glad to offer support. If you have a moment, please rate this item, I’ll appreciate it very much! Please don’t underestimate the power of the stars.
THANK YOU. 기타…
Each template within the Fishbone Diagram Infographic Set offers a visually engaging and intuitive design, allowing you to identify and display the underlying causes contributing to a problem or outcome. With a structured framework and customizable elements, these templates help you systematically explore various categories, such as people, process, environment, equipment, and more, to pinpoint the root causes of issues.
From business analysis and quality management to project planning and problem-solving, the Fishbone Diagram Infographic Set is ideal for a wide range of applications. These templates empower you to present complex information in a clear and concise manner, fostering better understanding and collaboration among team members, stakeholders, and decision-makers.
With easy-to-use customization options, you can tailor each template to suit your specific needs. Modify colors, fonts, and layout elements to align with your branding and data requirements, ensuring a cohesive and professional presentation of your fishbone diagrams.
▶ F E A T U R E
================
✔ Instant Download – your files are available immediately after purchase
✔ Professional, clean design
✔ Easy to edit in PowerPoint File
✔ 100% Editable
✔ Using a free font
▶ W H A T ' S I N S I D E
===========================
✔ PowerPoint File
✔ Help File Documentation
✔ Links to free fonts used
✔ Fast and friendly customer service for any help you may need
▶ S U P P O R T
================
For any help regarding this file, please feel free to contact me and I’ll be glad to offer support. If you have a moment, please rate this item, I’ll appreciate it very much! Please don’t underestimate the power of the stars.
THANK YOU. 기타…
더 많은 제품 MightySlide
관련 항목