
111526


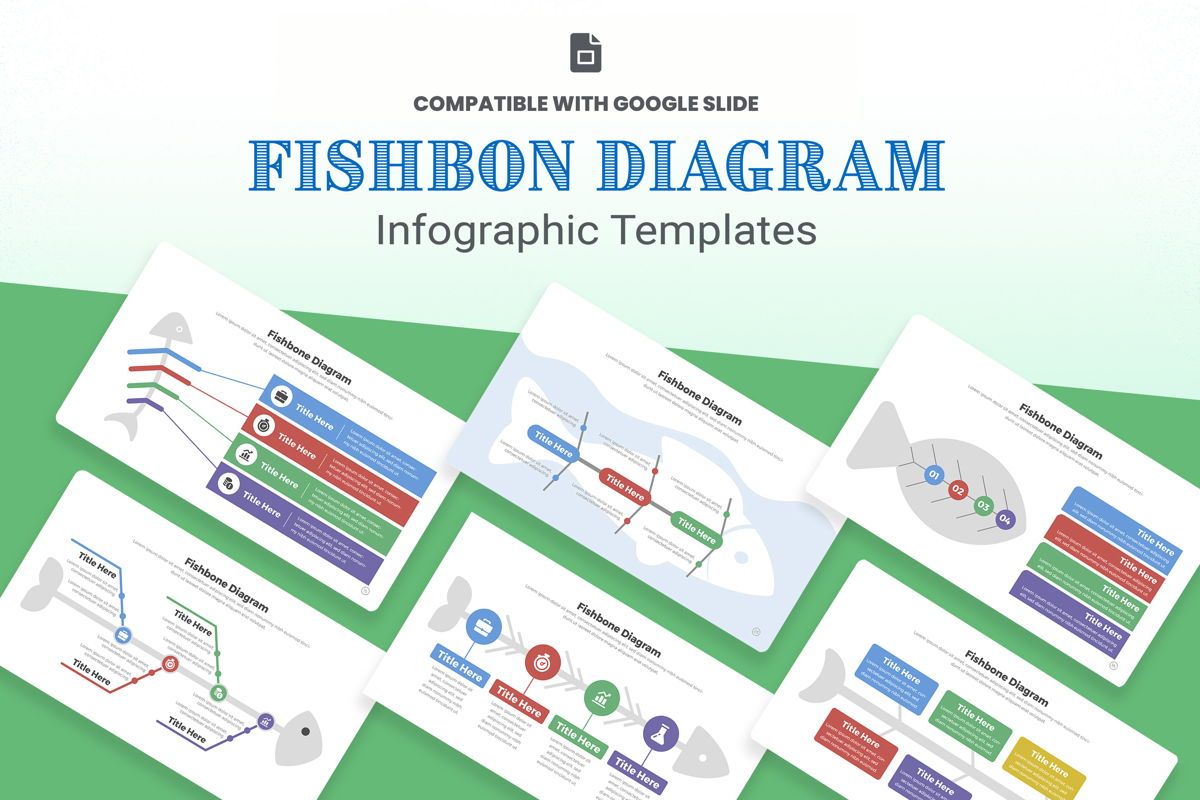
Fishbone Diagram Infographic Google Slide - Google 슬라이드 테마

ID: 11440
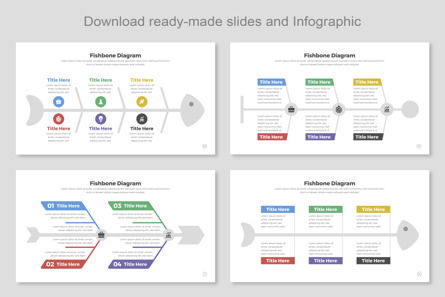
Unleash the power of visual problem-solving with our Fishbone Diagram Infographic Design. This meticulously crafted template is designed to help professionals analyze and understand the root causes of complex issues in a visually engaging and organized manner. With its sleek design and intuitive layout, it enables you to present information effectively and facilitate problem-solving discussions.
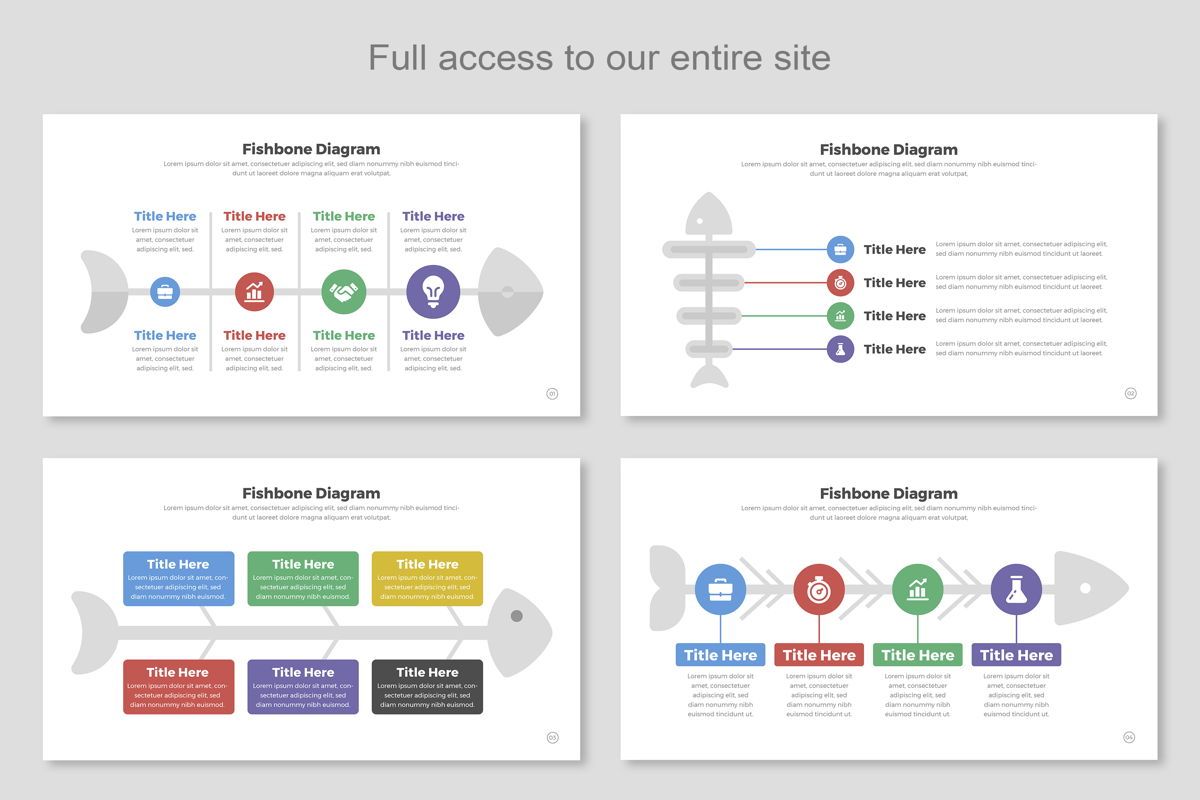
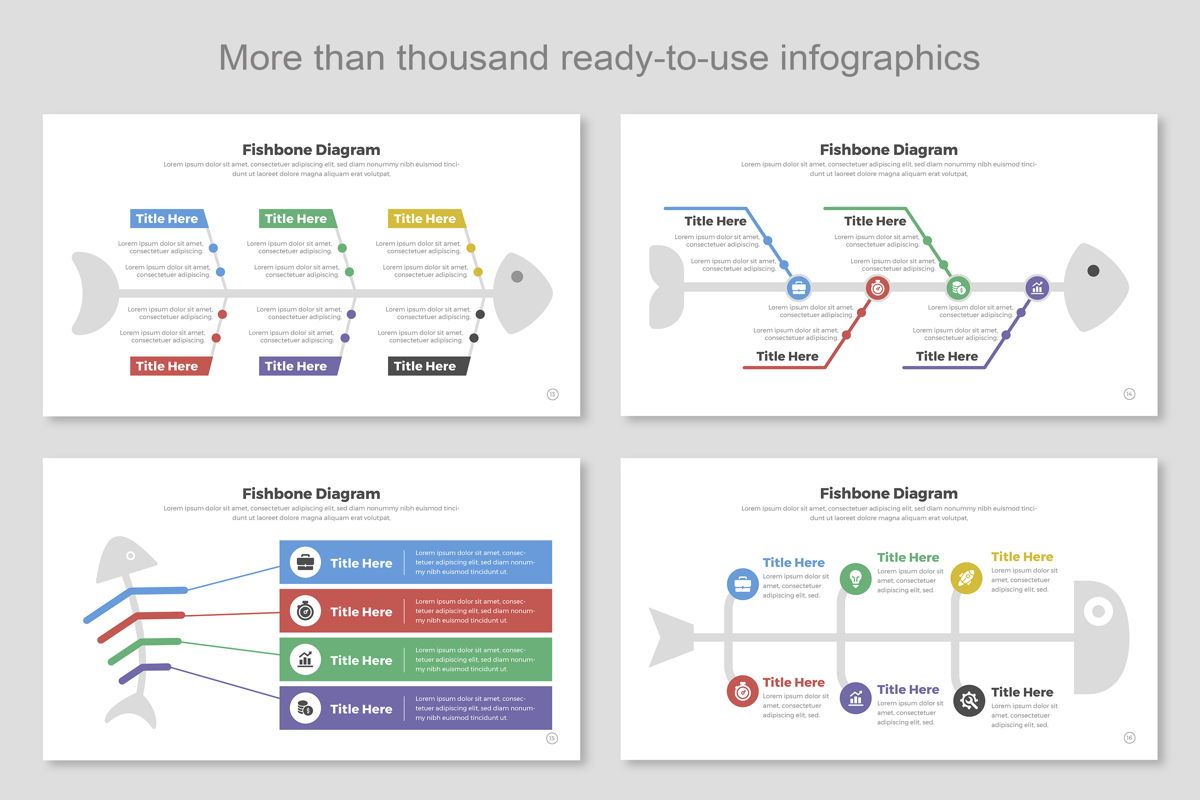
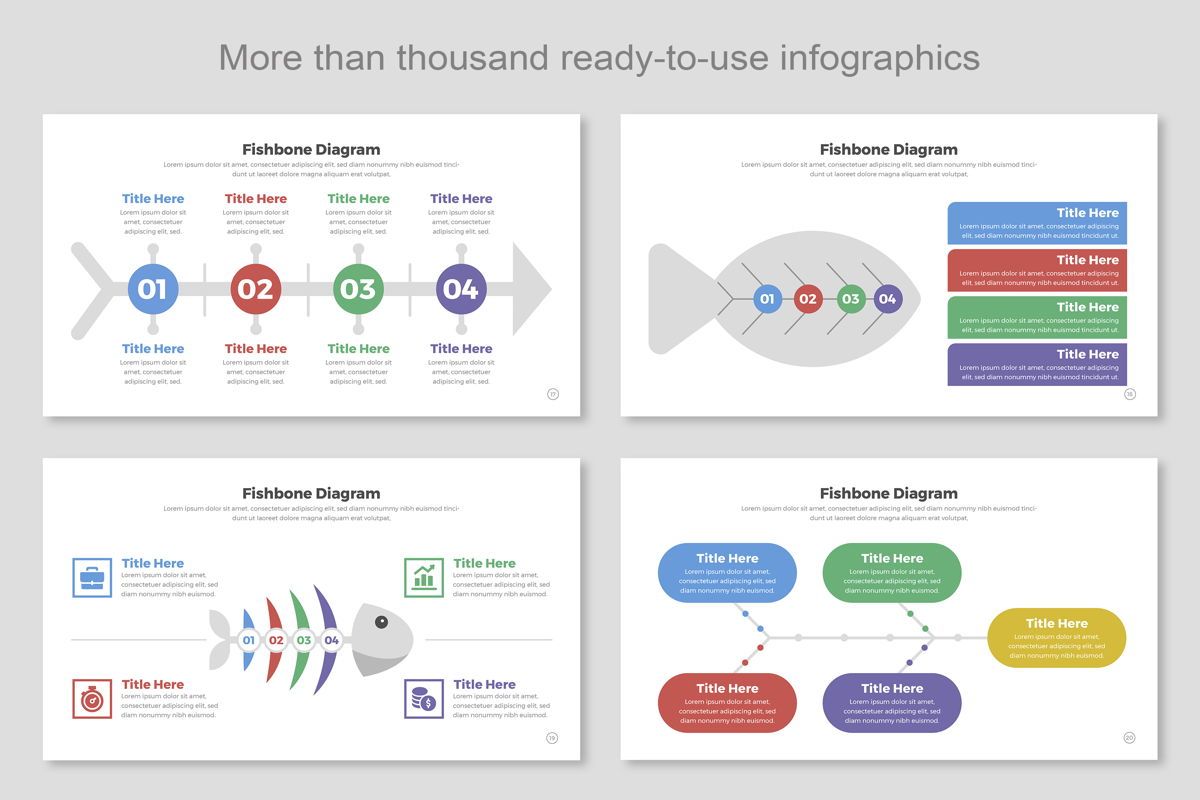
Our Fishbone Diagram Infographic Design provides a structured framework for identifying and categorizing the potential causes of a problem or situation. The fishbone shape, also known as the Ishikawa or cause-and-effect diagram, visually represents different factors that contribute to an issue. By utilizing this template, you can visually illustrate the cause-and-effect relationships, aiding in the analysis and resolution of problems.
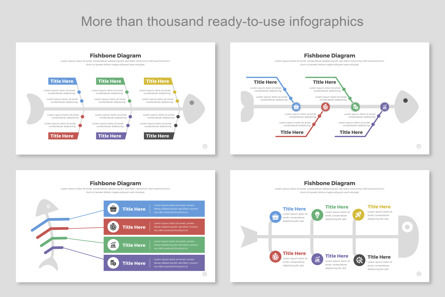
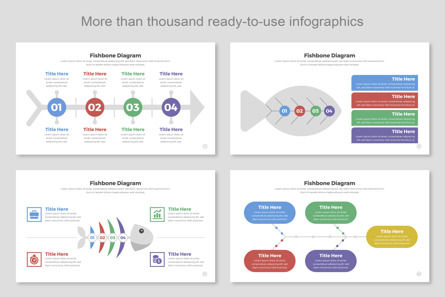
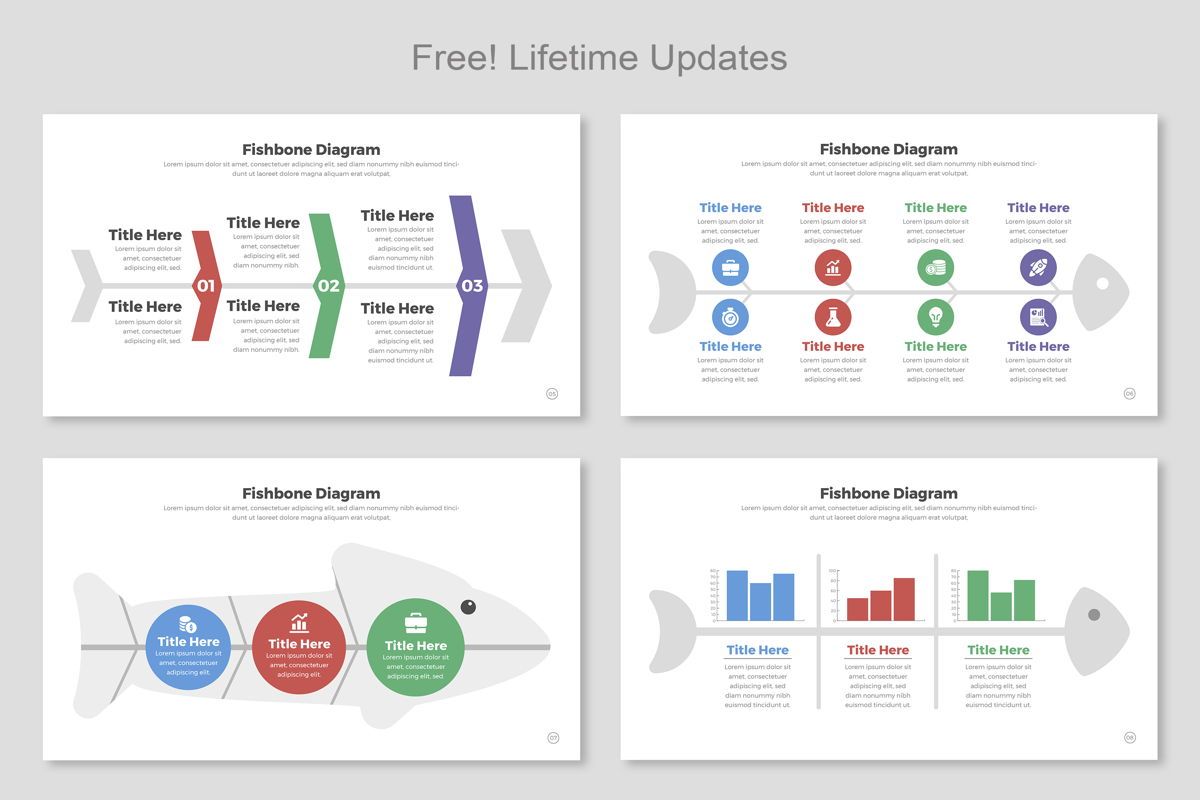
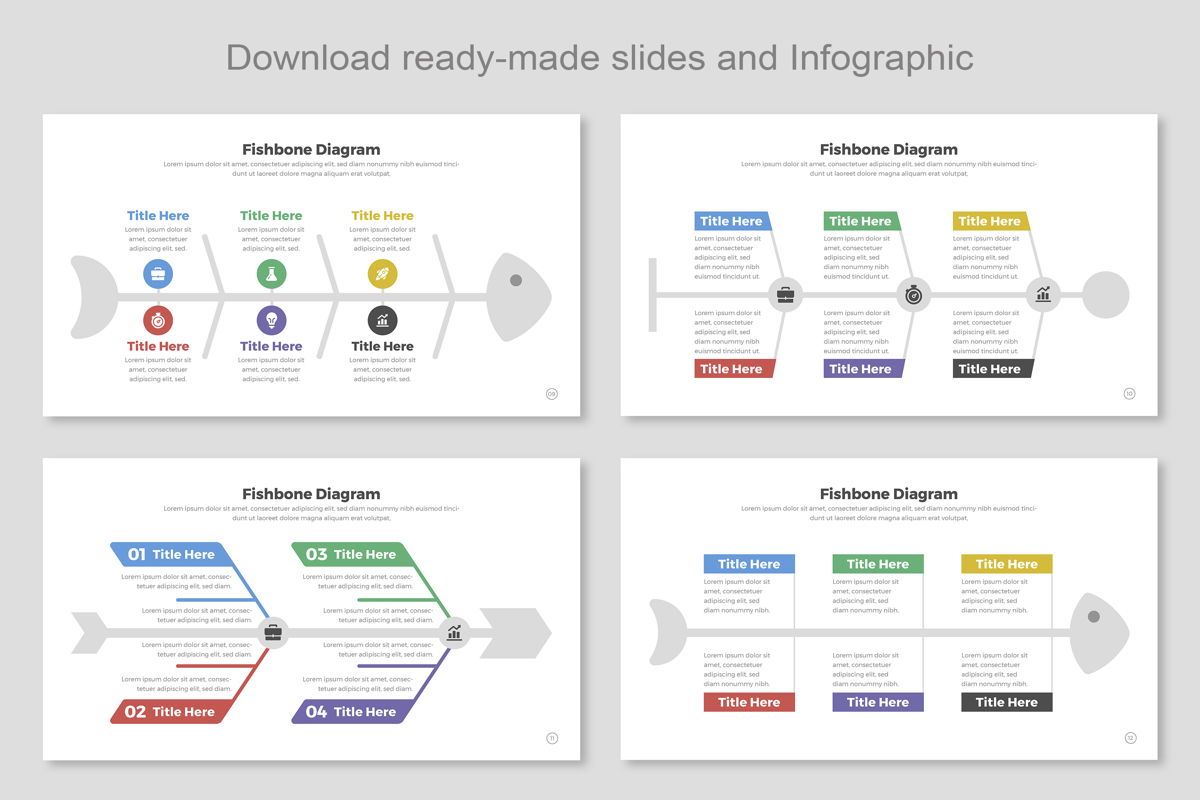
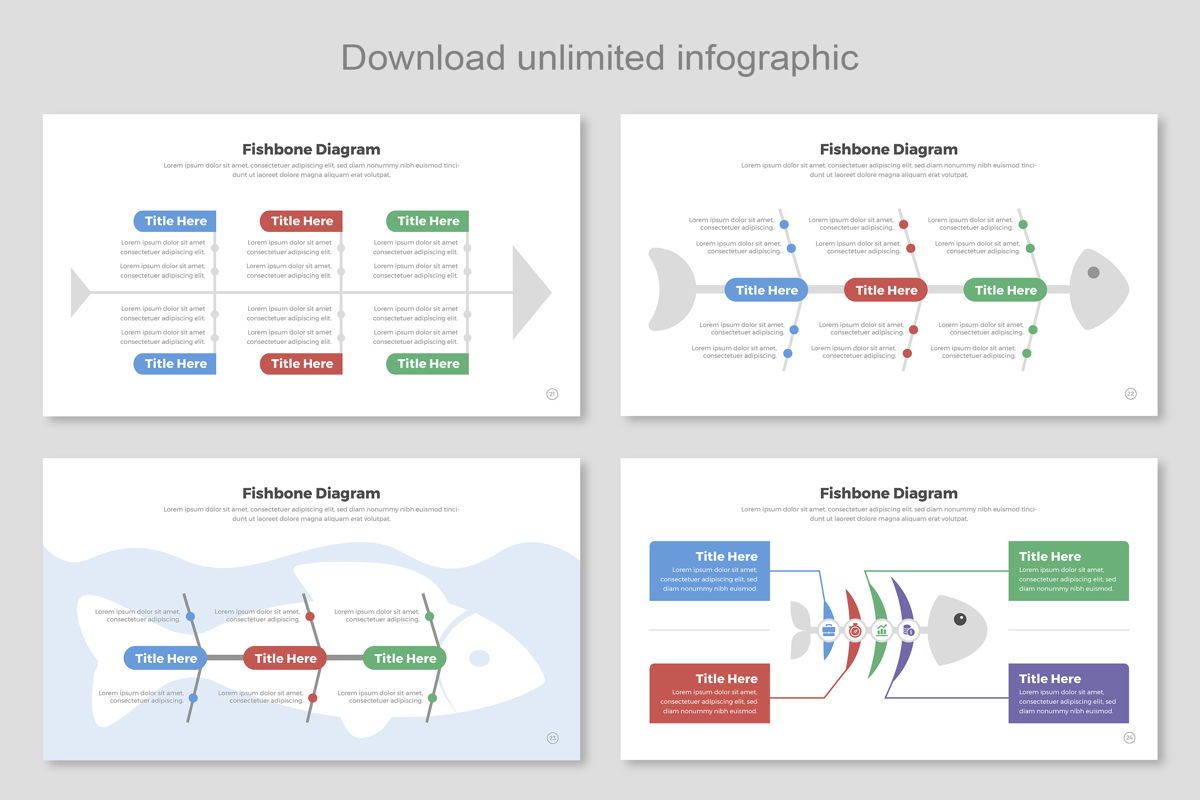
Customization is a breeze with our user-friendly interface. Easily modify colors, fonts, and sizes to align with your branding or personal preferences. The template offers a range of customizable elements and icons, allowing you to tailor the design to your specific needs. This flexibility ensures that your fishbone diagram is unique, visually appealing, and effectively communicates your analysis.
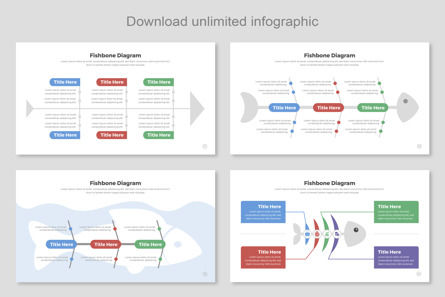
The Fishbone Diagram Infographic Design is compatible with various presentation software, including PowerPoint and Google Slides. This ensures seamless collaboration and accessibility across different platforms and devices, enabling you to share your problem-solving insights with a wider audience.
Empower your clients, colleagues, or stakeholders with the clarity and structure of our Fishbone Diagram Infographic Design. Whether you're conducting a root cause analysis, presenting findings, or facilitating discussions, this template will help you visually communicate complex issues and foster effective problem-solving.
▶ F E A T U R E
================
✔ Instant Download – your files are available immediately after purchase
✔ Professional, clean design
✔ Easy to edit in Google Slide
✔ 100% Editable
✔ Using a free font
▶ W H A T ' S I N S I D E
===========================
✔ Google Slide File
✔ Help File Documentation
✔ Links to free fonts used
✔ Fast and friendly customer service for any help you may need
▶ S U P P O R T
================
For any help regarding this file, please feel free to contact me and I’ll be glad to offer support. If you have a moment, please rate this item, I’ll appreciate it very much! Please don’t underestimate the power of the stars.
THANK YOU. 기타…
Our Fishbone Diagram Infographic Design provides a structured framework for identifying and categorizing the potential causes of a problem or situation. The fishbone shape, also known as the Ishikawa or cause-and-effect diagram, visually represents different factors that contribute to an issue. By utilizing this template, you can visually illustrate the cause-and-effect relationships, aiding in the analysis and resolution of problems.
Customization is a breeze with our user-friendly interface. Easily modify colors, fonts, and sizes to align with your branding or personal preferences. The template offers a range of customizable elements and icons, allowing you to tailor the design to your specific needs. This flexibility ensures that your fishbone diagram is unique, visually appealing, and effectively communicates your analysis.
The Fishbone Diagram Infographic Design is compatible with various presentation software, including PowerPoint and Google Slides. This ensures seamless collaboration and accessibility across different platforms and devices, enabling you to share your problem-solving insights with a wider audience.
Empower your clients, colleagues, or stakeholders with the clarity and structure of our Fishbone Diagram Infographic Design. Whether you're conducting a root cause analysis, presenting findings, or facilitating discussions, this template will help you visually communicate complex issues and foster effective problem-solving.
▶ F E A T U R E
================
✔ Instant Download – your files are available immediately after purchase
✔ Professional, clean design
✔ Easy to edit in Google Slide
✔ 100% Editable
✔ Using a free font
▶ W H A T ' S I N S I D E
===========================
✔ Google Slide File
✔ Help File Documentation
✔ Links to free fonts used
✔ Fast and friendly customer service for any help you may need
▶ S U P P O R T
================
For any help regarding this file, please feel free to contact me and I’ll be glad to offer support. If you have a moment, please rate this item, I’ll appreciate it very much! Please don’t underestimate the power of the stars.
THANK YOU. 기타…
더 많은 제품 MightySlide
관련 항목