97182
Stakeholder Onion Diagram - Google スライドと PowerPoint 用の無料プレゼンテーション テンプレート
ID: 10373
Free PowerPoint and Google Slides Template
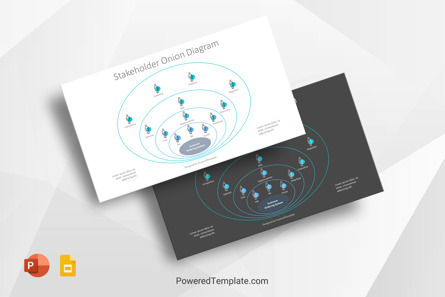
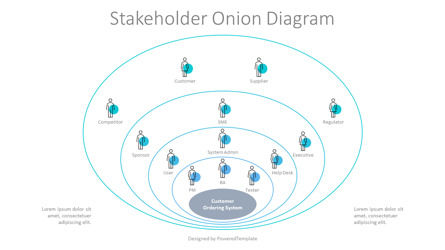
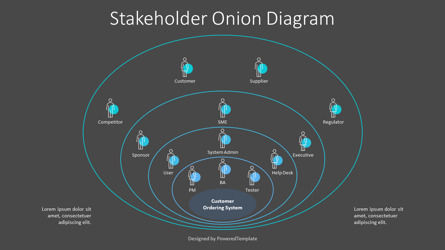
The Stakeholder Onion Diagram is an editable free presentation slide that works in Google Slides and PowerPoint has a minimalist design layout and represents 5 concentric circles with people icons as a concept of an onion diagram with 5 levels or layers:
* The Product or Solution
* The Business System
* The Business
* The Environment
* If used, the outer layer can be used for stakeholders who do not map to any other layers.
A stakeholder onion diagram is a way to visualize how stakeholders relate to a project goal. You can include additional information that shows relationships between stakeholders with each other or with certain levels of the project. But the main difference that sets onion apart is that it focuses on the project goal at the core, rather than the project itself or the key stakeholders.
A stakeholder onion chart is useful because it reflects the stakeholder's relationship to the end product or outcome of a project, rather than being based on power, influence, support, or other indicators. This is useful because it can show the importance of stakeholders who have little power or influence but will be important to the success of the final product.
Use this Stakeholder Onion Diagram presentation template to impress your audience with our outstanding Stakeholder Onion Diagram PowerPoint Template. Create professional PowerPoint presentations or Google Slides presentations on business analysis planning & monitoring topics that appeal to global audiences. Download instantly, tailor it with your information, and use it to look like a presentation pro.
Template Features:
* 100% editable and easy to modify
* 2 dark and light slides to impress your audience
* Contains easy-to-edit graphics
* Designed to be used in Google Slides and Microsoft PowerPoint
* 16:9 widescreen format suitable for all types of screens
* Includes information about fonts, colors, and credits of the free resources used.
無料サンプルをダウンロード. チャート&図の機能.もっと見る...
相关项目
エラーが発生しました
問題が発生しました。現時点ではこれしかわかりません。
ページを再読み込みして、もう一度お試しください。問題が解決しない場合は、30〜40分待ってから再試行してください。ご理解いただきありがとうございます。


