
81836


Circle Relationship Diagram - Google スライドと PowerPoint 用の無料プレゼンテーション テンプレート

ID: 09073
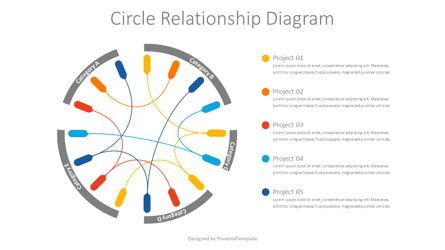
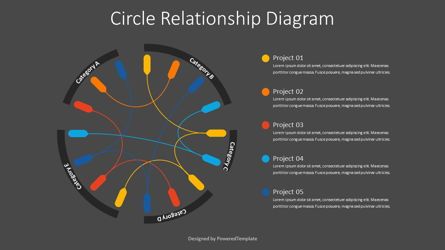
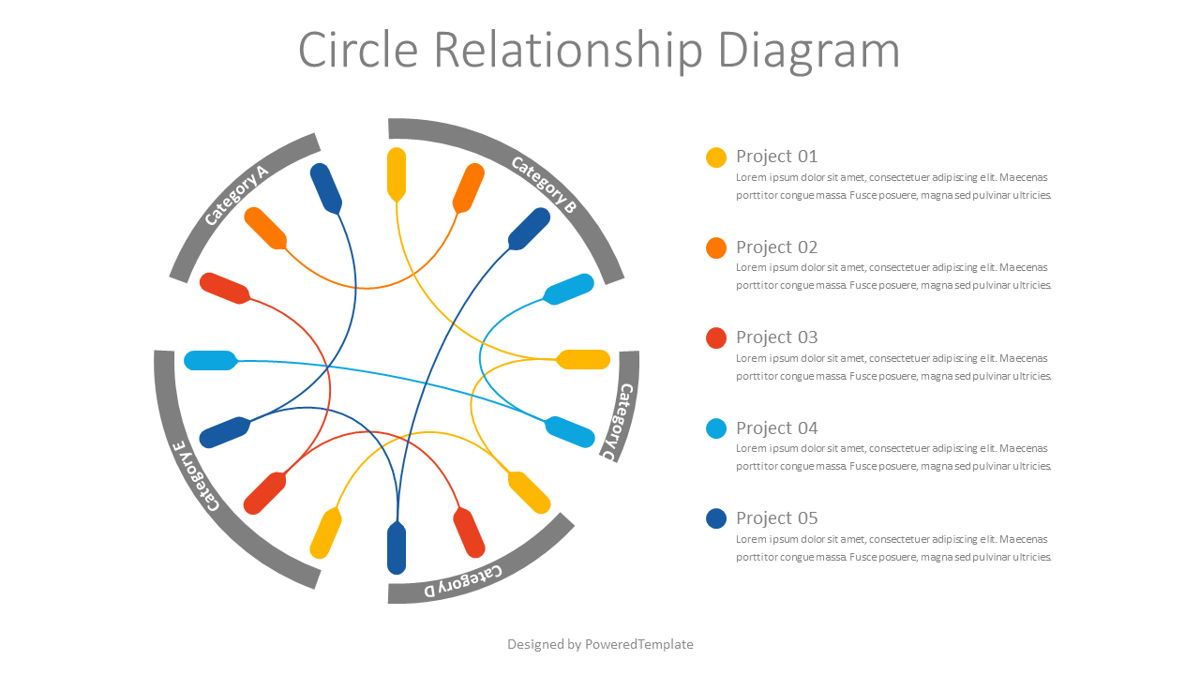
Circular relationship graph which plots a network of interconnected nodes as a circle. The visualization displays the data relationships between the categories or groups and projects. On the diagram, the categories are displayed as arcs on the circle. The size of each segment or arc is proportional to the number of projects relating to the category.
Template Features:
- 16:9 Ratio
- Light and Dark background
- 2 Slides with Editable Shapes
- Easy to change colors, Fully editable texts
- Standard font used
無料サンプルをダウンロード. チャート&図の機能.もっと見る...
Template Features:
- 16:9 Ratio
- Light and Dark background
- 2 Slides with Editable Shapes
- Easy to change colors, Fully editable texts
- Standard font used
無料サンプルをダウンロード. チャート&図の機能.もっと見る...
相关项目