
99182


Cool Donut Chart Infographic Template - Google Slides-Design und PowerPoint-Vorlage

ID: 10686
Entsperren Sie diese Datei und greifen Sie auf andere Premium-Ressourcen zu
Werden Sie Premium und Download! | Bereits Premium? Anmeldung
Entsperren Sie diese Datei und greifen Sie auf andere Premium-Ressourcen zu
Werden Sie Premium und Download! | Bereits Premium? Anmeldung
Premium Google Slides theme and PowerPoint template
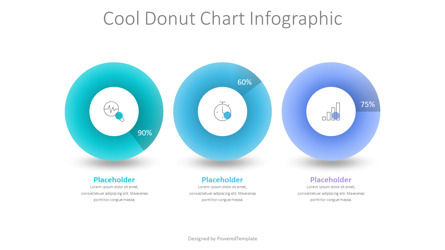
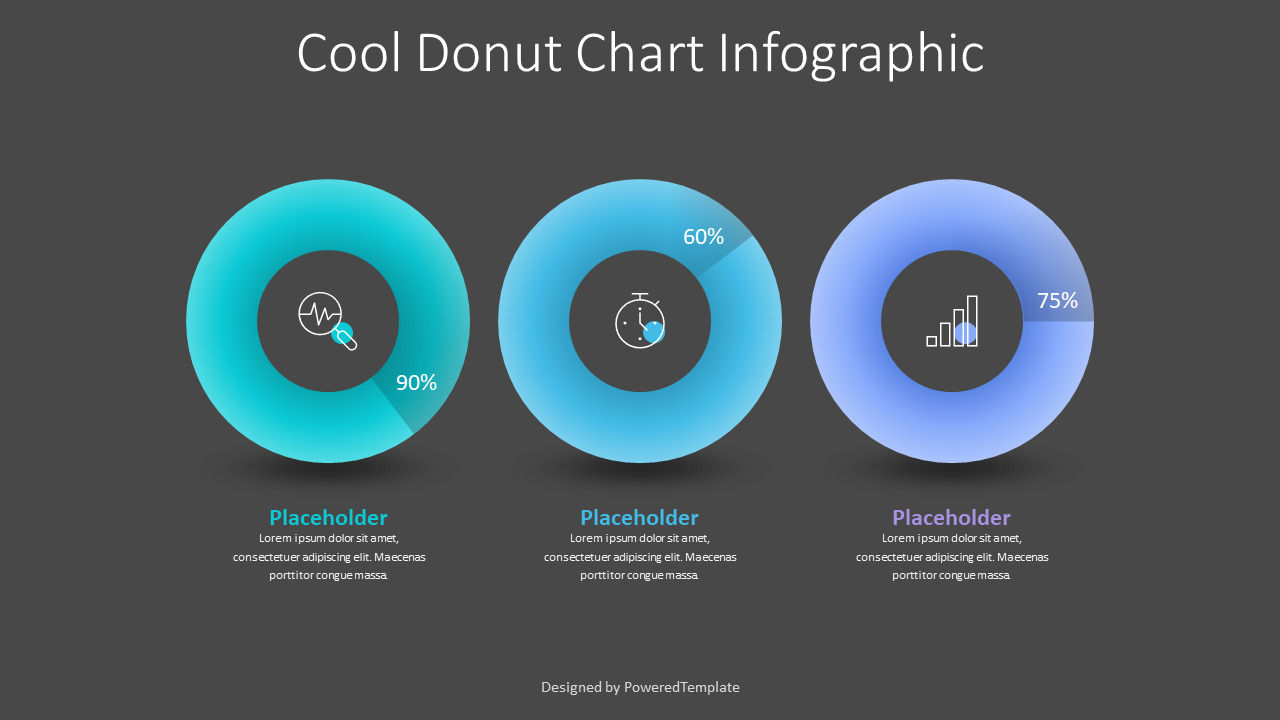
The Cool Donut Chart Infographic Template is an editable premium presentation theme that works in Google Slides and PowerPoint and contains creative doughnut diagrams that can be easily edited and customized for all presentation needs.
The Cool Donut Chart Infographic Template for PowerPoint is suitable for business plans and deliberations where the comparison allocation is being discussed. A donut chart infographic is a type of pie chart that helps to display complex statistical information or multiple data in an easy-to-understand way, and can showcase relative changes in the values in a visually stunning manner.
Use this Cool Donut Chart Infographic Template presentation template layout to impress your audience with an outstanding Cool Donut Chart Infographic Template PowerPoint template for both business and academic presentations. Create professional PowerPoint presentations or Google Slides presentations on market comparisons, product-wise sales figures, product average sales, and product distribution in different areas and sections topics that appeal to global audiences. Download instantly, tailor it with your information, and use it to look like a presentation pro.
Template Features:
* 100% editable and easy to modify
* 2 dark and light slides to impress your audience
* Contains easy-to-edit graphics
* Designed to be used in Google Slides and Microsoft PowerPoint
* PPT/PPTX format file
* 16:9 widescreen format suitable for all types of screens
* Includes information about fonts, colors, and credits of the free resources used.
Download Kostenlose Beispiele. Charts und Diagramme Produktmerkmale.Mehr...
Verwandte Vorlagen