Top

Copy and paste the following code for attribution and get our Free License. Don’t want to provide attribution? Go Premium for more usage rights without attribution!

Node-Link Diagram Toolbox, 03980, Graph Charts — PoweredTemplate.com
Node-Link Diagram Toolbox, Slide 2, 03980, Graph Charts — PoweredTemplate.com
Node-Link Diagram Toolbox, Slide 3, 03980, Graph Charts — PoweredTemplate.com
Node-Link Diagram Toolbox, Slide 4, 03980, Graph Charts — PoweredTemplate.com
Node-Link Diagram Toolbox, Slide 5, 03980, Graph Charts — PoweredTemplate.com
Node-Link Diagram Toolbox, Slide 6, 03980, Graph Charts — PoweredTemplate.com
Node-Link Diagram Toolbox, Slide 7, 03980, Graph Charts — PoweredTemplate.com
Node-Link Diagram Toolbox, Slide 8, 03980, Graph Charts — PoweredTemplate.com
Node-Link Diagram Toolbox, Slide 9, 03980, Graph Charts — PoweredTemplate.com
Node-Link Diagram Toolbox, Slide 10, 03980, Graph Charts — PoweredTemplate.com
Node-Link Diagram Toolbox, Slide 11, 03980, Graph Charts — PoweredTemplate.com
Node-Link Diagram Toolbox, Slide 12, 03980, Graph Charts — PoweredTemplate.com
Node-Link Diagram Toolbox, Slide 13, 03980, Graph Charts — PoweredTemplate.com
Node-Link Diagram Toolbox, Slide 14, 03980, Graph Charts — PoweredTemplate.com
Node-Link Diagram Toolbox, Slide 15, 03980, Graph Charts — PoweredTemplate.com
Node-Link Diagram Toolbox, Slide 16, 03980, Graph Charts — PoweredTemplate.com

Quick Navigation Guide

Tap or click on the thumbnails here to view more images. You can also scroll left or right above or use the arrow keys on your keyboard.

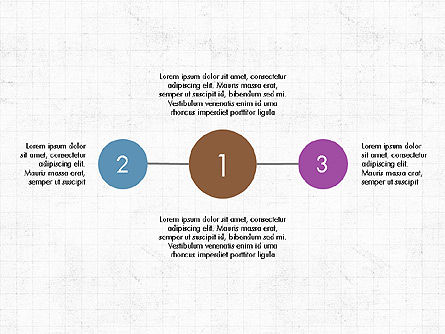
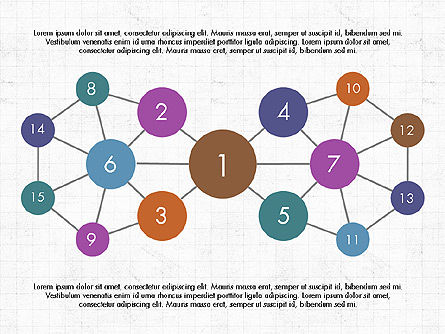
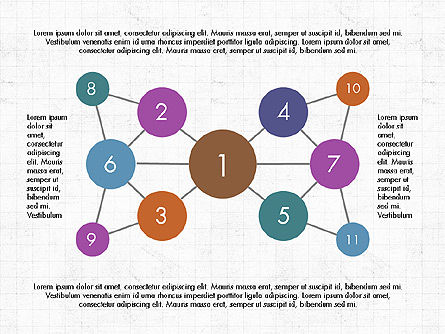
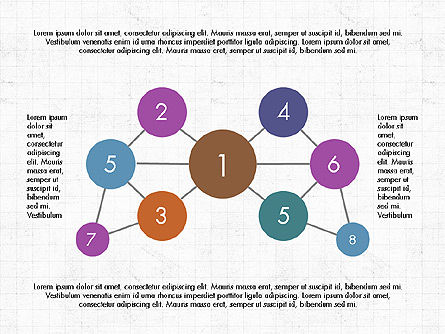
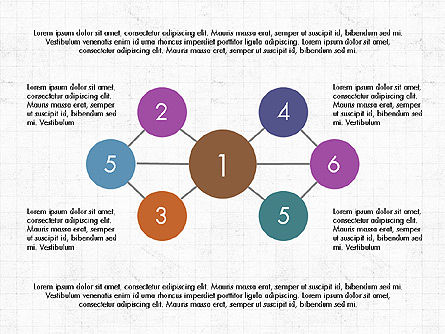
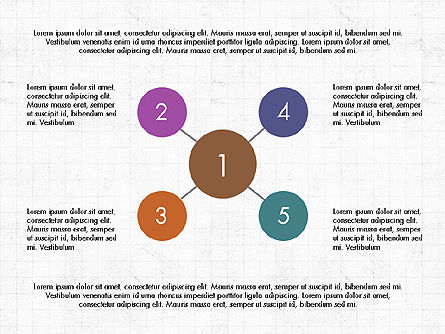
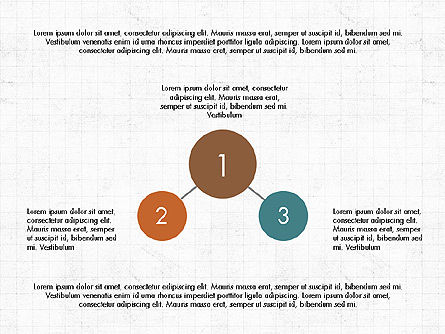
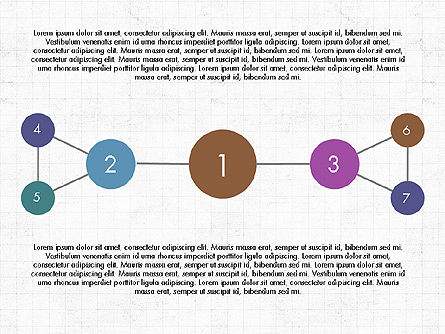
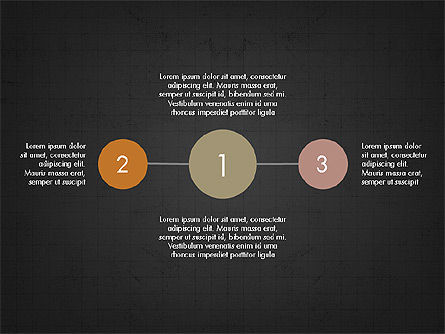
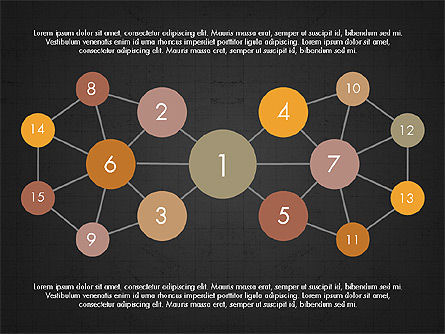
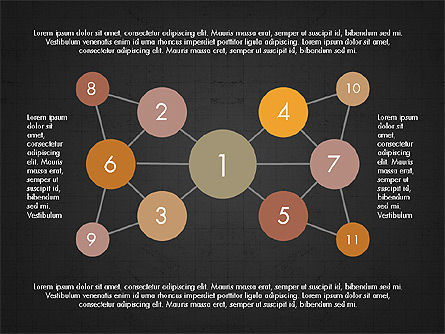
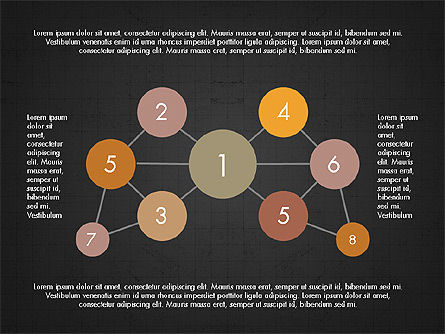
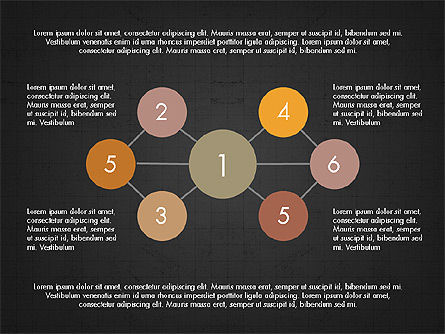
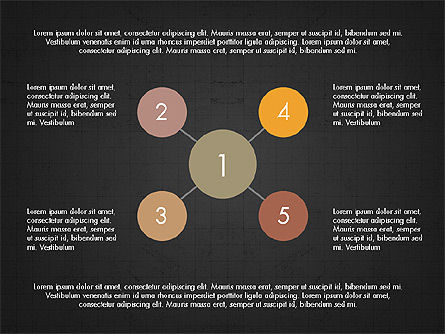
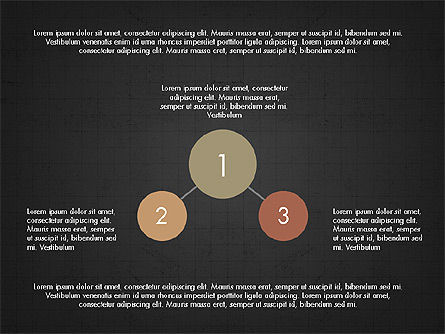
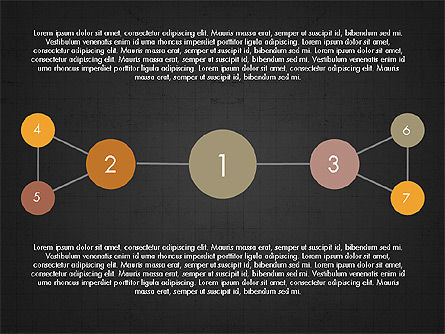
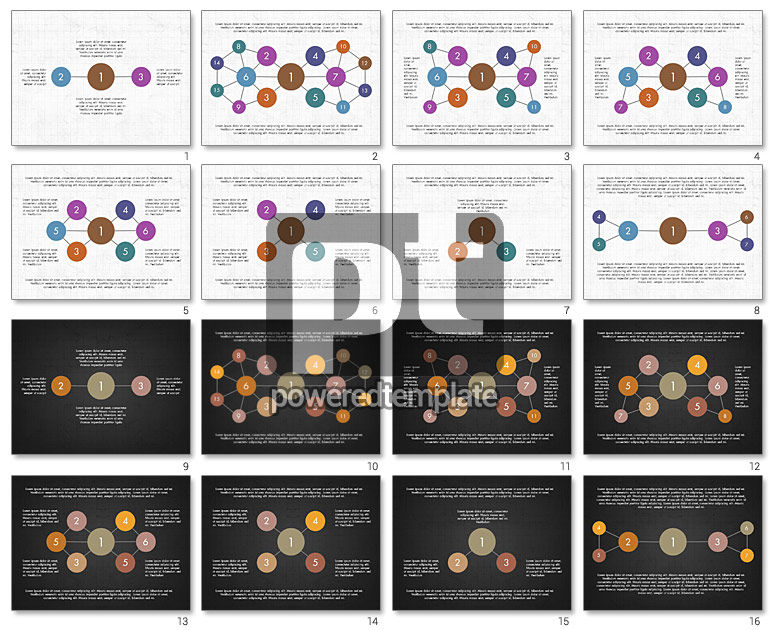
Node-Link Diagram Toolbox (for PowerPoint and Google Slides)

Since July 18, 2004
ID: 03980
4.0 of 5(1)
Premium resource

Unlock this file and gain access to other Premium resources.

Go Premium and Download!  |  Already Premium? Sign in

Premium resource

Unlock this file and gain access to other Premium resources.

Go Premium and Download!  |  Already Premium? Sign in

This node-link presentation symbolizes the connection of all important parts of the message that the orator tries to bring to the audience. Various colorful bubbles are connected between themselves and look like a molecule. Such graphic presentation can be applied in different areas, for example to show the location of the players in the game. Download Free Samples. Charts and Diagrams Features.More...
Node-Link Diagram Toolbox

Related Items

You have not viewed any products yet.

Start browsing our template library and here will be stored your history of viewed products.

Use "Favorites" to save products you find interesting, to compare them and add to cart. To add products in favorites you must first register or login. Registration is Free!

To add a product to "Favorites" simple click on near product's image.