99162
6-Step Core Diagram - Gratis presentatiesjabloon voor Google Slides en PowerPoint
ID: 10680
Gratis voor persoonlijk en commercieel gebruik met toeschrijving vereist.
Hoe de auteur te schrijven?Ontgrendel dit bestand en krijg toegang tot andere Premium-bronnen
Word Premium en Download! | Al Premium? Inloggen
Free Google Slides Theme and PowerPoint Template
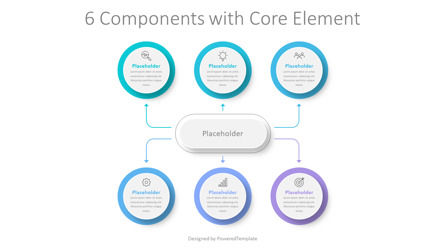
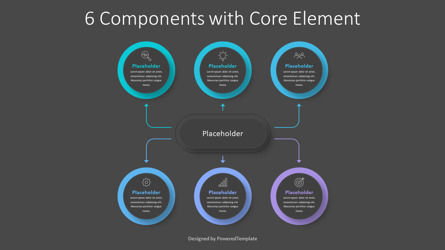
The 6-Step Core Diagram is an editable free animated infographic presentation template that works in Google Slides and PowerPoint has a mind-map structure design and contains 1 rectangular shape (a core) with rounded corners and 6 circles arranged circularly in the canvas. This mind-map template is helpful to explain related concepts, problem-solving ideas, various learning purposes, or flow processes that consist of 6 steps, stages, parts, phases, milestones, options, features, or milestones.
The central shape represents the main subject, and the other 6 circles indicate the components of the process. Each shape is connected to the center with curved arrows that represent the meaning of each element with a central idea.
Use this 6-Step Core Diagram animated infographic slide to impress your audience with our outstanding 6-Step Core Diagram animated infographic PowerPoint slide template. Create professional PowerPoint presentations or Google Slides presentations on business growth strategies, and project management, to discuss ideas to increase business revenue, business personnel, and academic concept topics that appeal to global audiences that appeal to global audiences. Download instantly and tailor it with your information, and use it to look like a presentation pro.
Template Features:
* 100% editable and easy to modify
* 2 dark and light animated slides to impress your audience
* Contains easy-to-edit graphics
* Designed to be used in Google Slides and Microsoft PowerPoint
* PPT/PPTX format file
* 16:9 widescreen format suitable for all types of screens
* Includes information about fonts, colors, and credits of the free resources used.
Download Gratis Voorbeelden. Grafieken en Diagrammen Kenmerken.Meer...
Gerelateerde items
Er is een fout opgetreden
Er is iets misgegaan. Dat is alles wat we op dit moment weten.
Vernieuw de pagina en probeer het opnieuw. Als het probleem aanhoudt, wacht dan 30-40 minuten voordat u het opnieuw probeert. We waarderen uw geduld.


