
98732


Waterfall Vs Agile Process Diagram - Google 슬라이드 및 파워포인트용 무료 프리젠테이션 템플릿

ID: 10569
Free PowerPoint and Google Slides Template
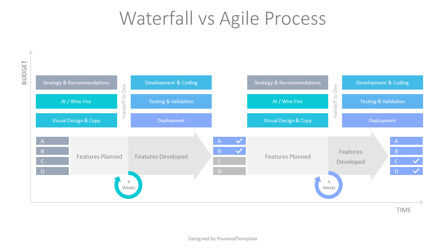
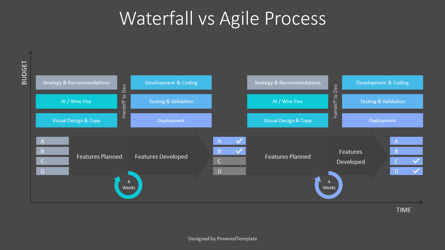
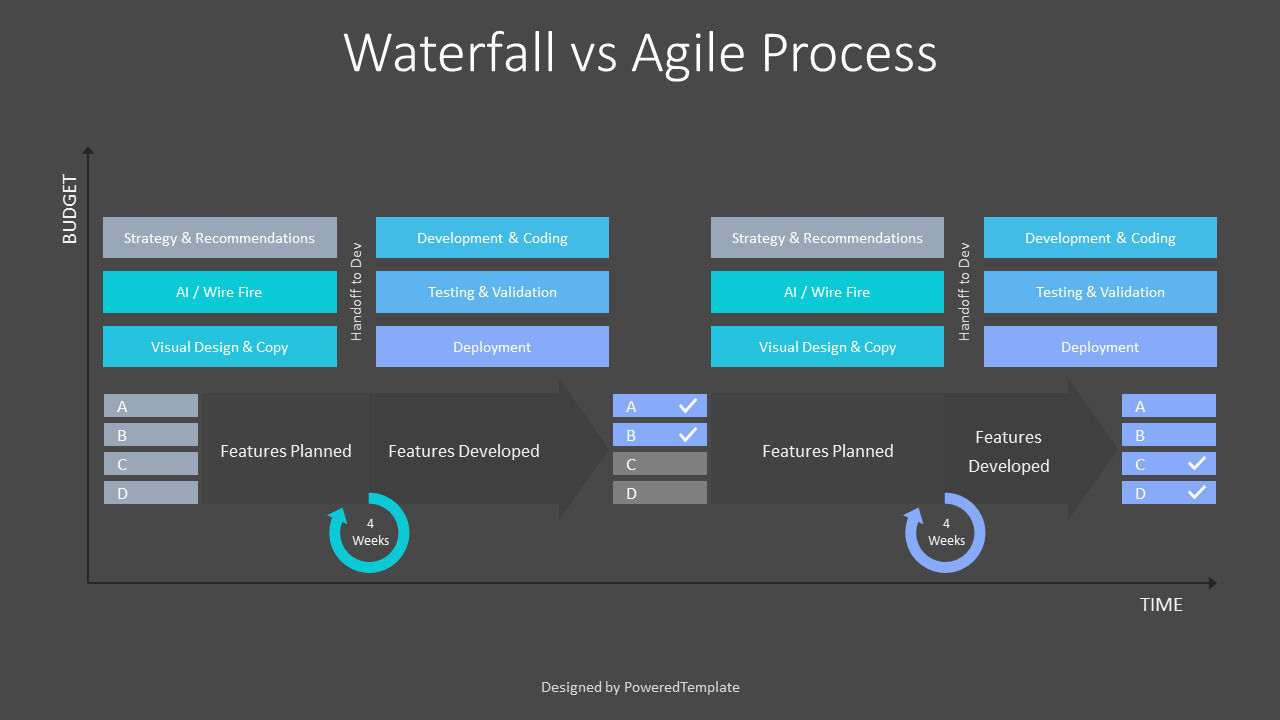
The Waterfall vs Agile Process Diagram is an editable free animated presentation infographic template that works in Google Slides and PowerPoint and contains a time/budget chart with 2 different processes showing Waterfall and Agile processes and their differences: Waterfall is a linear system of working that requires the team to complete each project phase before moving on to the next one while Agile encourages the team to work simultaneously on different phases of the project.
What is the Waterfall methodology?
The Waterfall Model methodology is also known as the Linear Sequential Life Cycle Model. The Waterfall Model follows in sequential order, so the project development team only moves to the next stage of development or testing if the previous stage is completed successfully.
What is the Agile methodology?
The Agile methodology is a practice that encourages continuous iteration of development and testing throughout the software development process. In this model, development and testing are done simultaneously, unlike the Waterfall model. This process allows for more communication between customers, developers, managers, and testers.
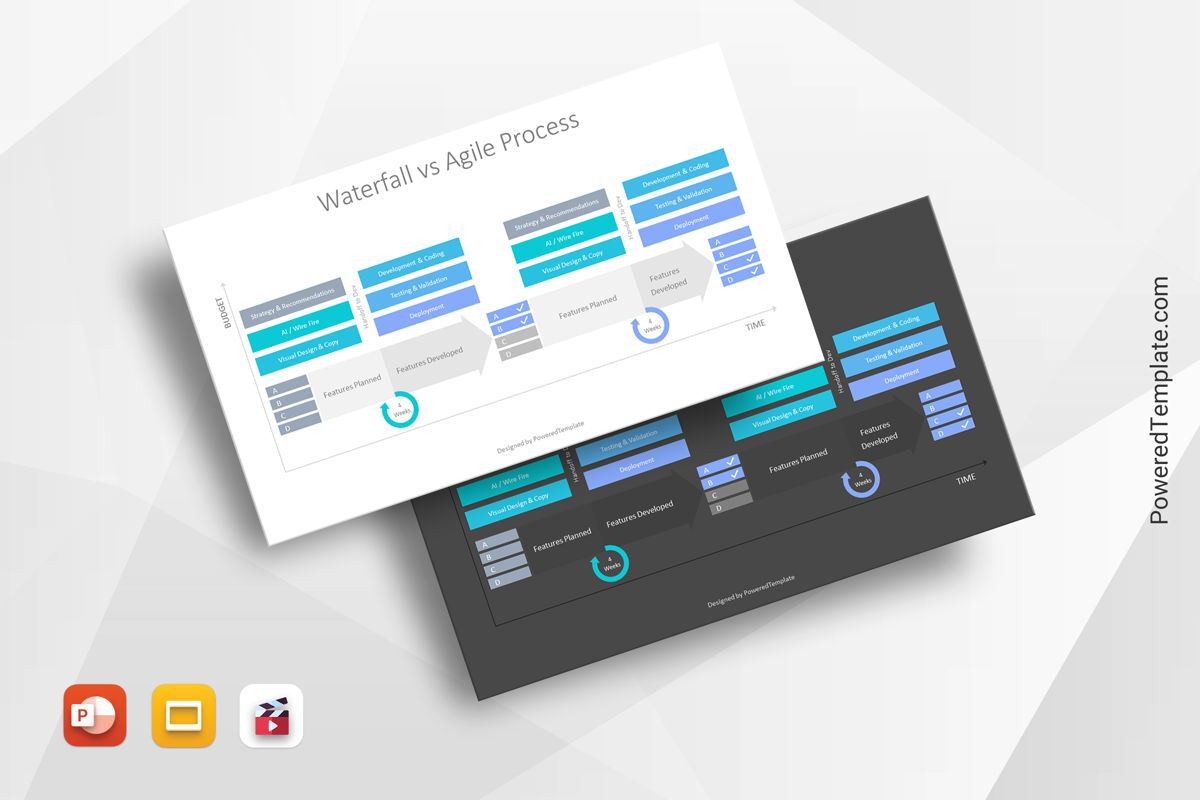
Use this Waterfall vs Agile Process Diagram free presentation template to impress your audience with an outstanding Waterfall vs Agile Process Diagram Free PowerPoint Template. With this highly visual infographic design template, presenters can create engaging presentations, and make their ideas easy to understand for the audience. This 4-Step Infographic template can be used for educational, business, technology, or other presentation topics. The slides are simple to edit and are provided in two background color variations.
Create professional PowerPoint presentations or Google Slides presentations on arranging complex data in an organized way, and project planning topics that appeal to global audiences. Download instantly, tailor it with your information, and use it to look like a presentation pro.
Template Features:
* 100% editable and easy to modify
* 2 dark and light animated slides to impress your audience
* Contains easy-to-edit graphics
* Designed to be used in Google Slides and Microsoft PowerPoint
* PPTX format file
* 16:9 widescreen format suitable for all types of screens
* Includes information about fonts, colors, and credits of the free resources used.
무료 샘플 다운로드. 차트 및 도표 특성.기타…
관련 항목