
97731


Six Sigma DMAIC Infographic - Google スライドと PowerPoint 用の無料プレゼンテーション テンプレート

ID: 10442
Free PowerPoint and Google Slides Template
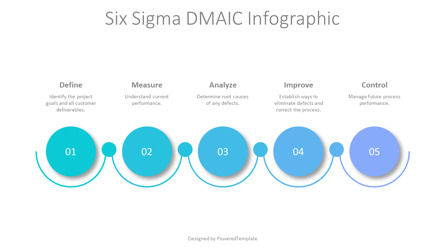
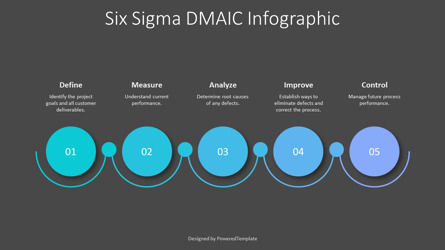
The Six Sigma DMAIC Infographic is an editable free animated presentation template that works in Google Slides and PowerPoint designed in a minimalist design layout and represents 5 circular shapes forming a horizontal process flow roadmap with 5 steps. stages, parts, phases, milestones, or options.
The template is a concept of the Six Sigma DMAIC infographic. DMAIC stands for Define, Measure, Analyze, Improve, and Control and it is a methodology based on these 5 improvement steps. The DMAIC model is a roadmap for Six Sigma, used to improve the quality of results that company processes produce:
Define
The Lean Six Sigma DMAIC process begins with a definition step where the problem is defined, as well as the customer, voice of the customer (VOC), and critical quality (CTQ), then the target process topic and other related business processes, goals or objectives of the project, boundaries, and scope of the project, as well as the project charter, often created during the definition step.
Measurement
The Measurement process can then establish the current baseline as a basis for improvement, determine the gap between current and required performance, and collect data to create a process performance baseline for the project metric. In the analysis process, the goal is to verify and select the root cause for elimination.
Improvement
In the Improvement process, the goal is to identify, test, and implement a solution to a problem. Here you can use some or all of the metaphors with creative slides, or create slides based on techniques like Six Thinking Hats or Random Word as an idea generation technique. During the improvement phase, you can create innovative solutions, focus on the simplest and easiest solutions, and use tools like the PDCA cycle to test solutions and get results.
Control
During the Control phase, the idea is to maintain the achievements, and control the improvements identified and measured, to ensure continuous and sustainable success.
Use this Six Sigma DMAIC Infographic Free presentation template to impress your audience with an outstanding Six Sigma DMAIC Infographic Free PowerPoint Template. Create professional PowerPoint presentations or Google Slides presentations on project management and process improvement topics that appeal to global audiences. Download instantly, tailor it with your information, and use it to look like a presentation pro.
Template Features:
* 100% editable and easy to modify
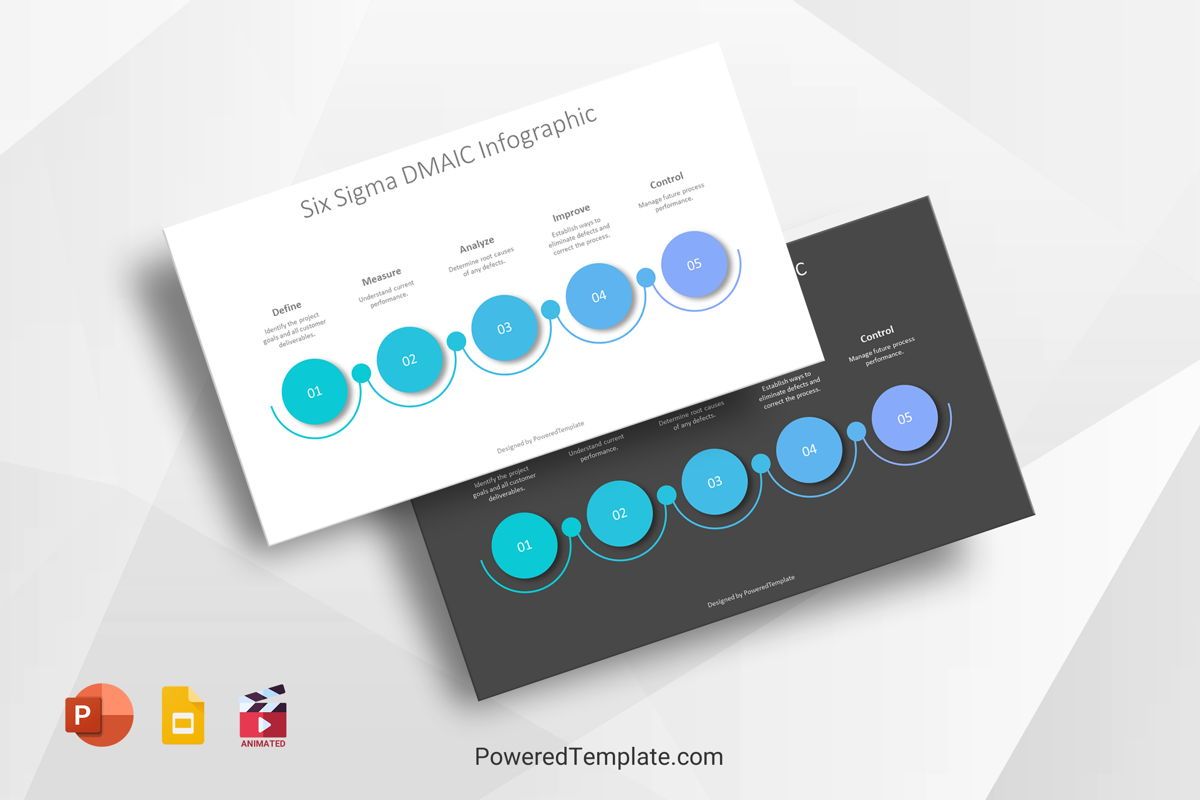
* 2 dark and light animated slides to impress your audience
* Contains easy-to-edit graphics
* Designed to be used in Google Slides and Microsoft PowerPoint
* PPTX format file
* 16:9 widescreen format suitable for all types of screens
* Includes information about fonts, colors, and credits of the free resources used.
無料サンプルをダウンロード. チャート&図の機能.もっと見る...
相关项目