97953
Donut Chart Report Template - Google スライドと PowerPoint 用の無料プレゼンテーション テンプレート
ID: 10468
Free PowerPoint and Google Slides Template
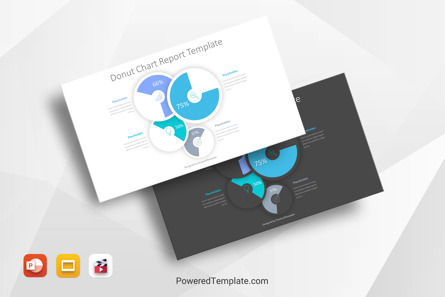
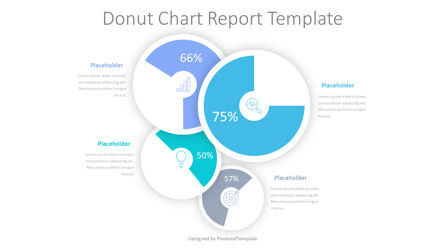
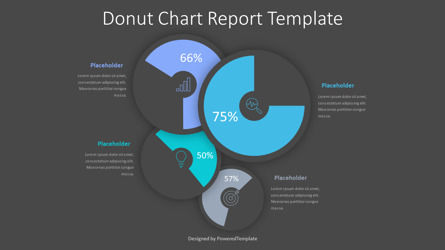
The Donut Chart Report Template is an editable free animated presentation infographic template that works in Google Slides and PowerPoint contains 4 stages in the shapes of concentric semi-circles painted with different colors, has a volumetric effect as the creative concept of a performance or financial report with 4 different rates and values.
This donut chart shows various attributes, their percentage, and values in multiple levels or groups. It can show the most desirable product in a higher percentage. Or use this infographic template to explain global statistics in a learning presentation. Such as the demographics of a country, continent, or this world.
Use this Donut Chart Report Template free presentation template to impress your audience with an outstanding Donut Chart Report Template Free PowerPoint Template to compare the sales and likability of four products of the company. Create professional PowerPoint presentations or Google Slides presentations to showcase your company highlights and company performance topics that appeal to global audiences. Download instantly, tailor it with your information, and use it to look like a presentation pro.
Template Features:
* 100% editable and easy to modify
* 2 dark and light animated slides to impress your audience
* Contains easy-to-edit graphics
* Designed to be used in Google Slides and Microsoft PowerPoint
* PPTX format file
* 16:9 widescreen format suitable for all types of screens
* Includes information about fonts, colors, and credits of the free resources used.
無料サンプルをダウンロード. チャート&図の機能.もっと見る...
相关项目
エラーが発生しました
問題が発生しました。現時点ではこれしかわかりません。
ページを再読み込みして、もう一度お試しください。問題が解決しない場合は、30〜40分待ってから再試行してください。ご理解いただきありがとうございます。


