


Free Google Slides Theme and PowerPoint Template
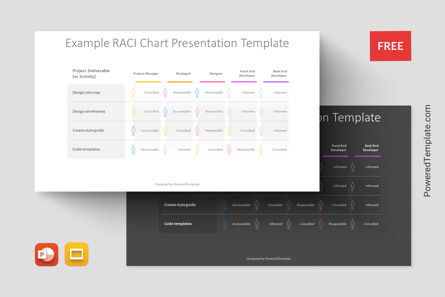
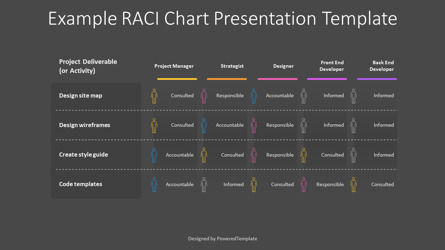
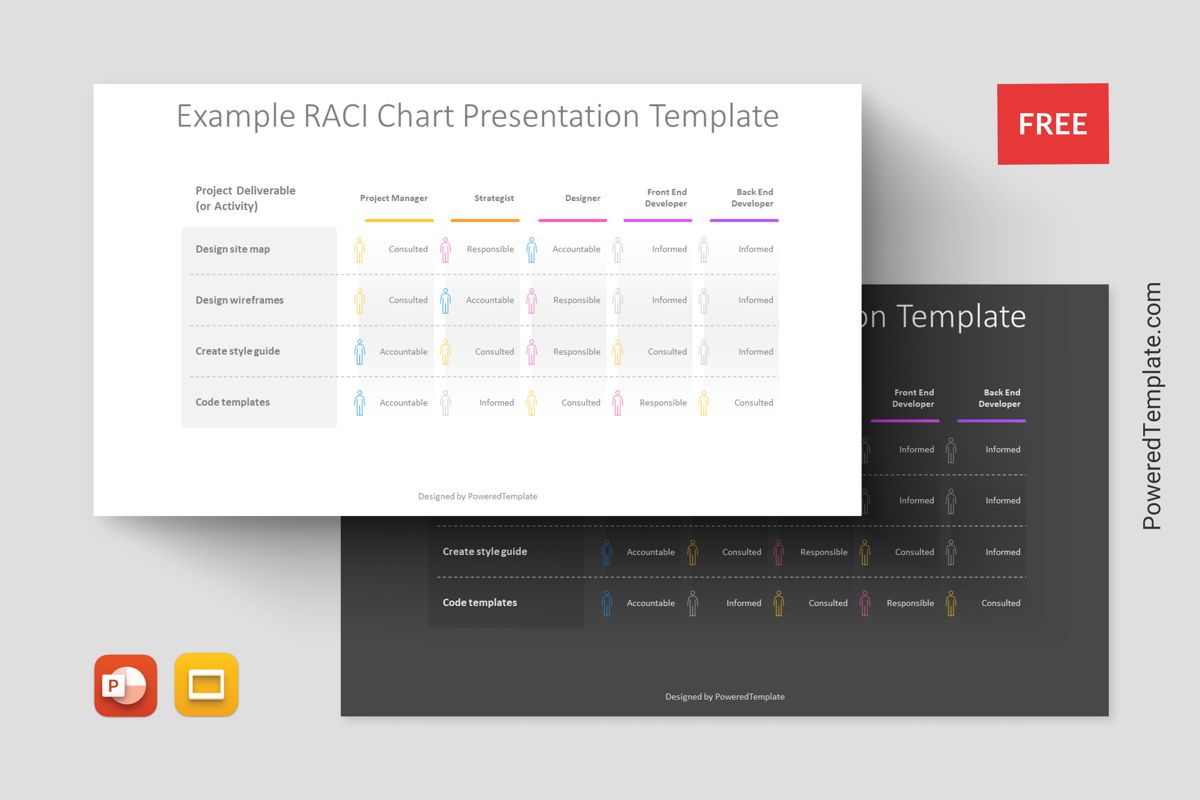
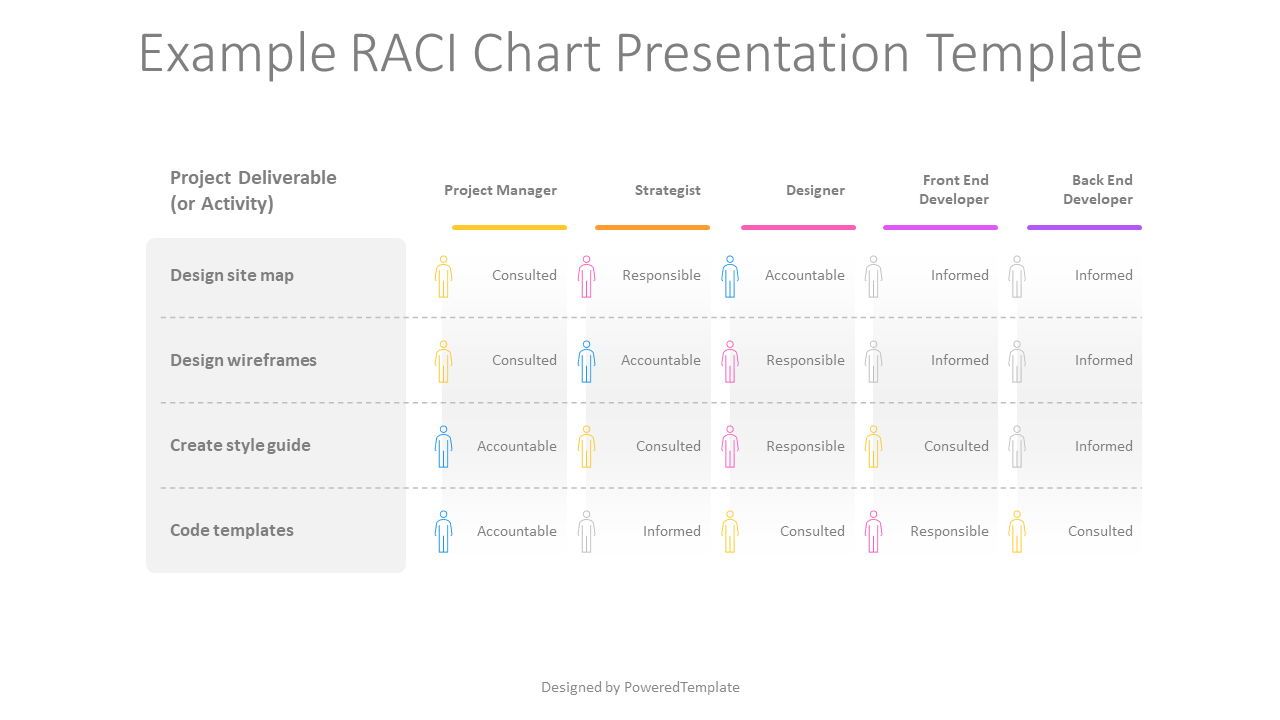
Introducing the Example RACI Chart presentation template, a powerful tool designed to streamline project management and enhance team collaboration. Compatible with both PowerPoint and Google Slides, this template is available for free, making it accessible to professionals from all walks of life.The design of this free template is clean, minimalist, and functional, ensuring that the focus remains on the content and the effective communication of roles and responsibilities. At the core of the template is a 6x5 table, organized with precision and clarity.
The title row sets the stage for the RACI Chart, clearly indicating the project deliverables or activities. In this particular template, the examples provided include Design site map, Design wireframes, Create style guide, and Code templates. These represent key tasks or components of a project that require specific responsibilities.
The left column of the table is dedicated to listing the individuals or roles involved in the project. The titles of the following five columns are as follows: Project Manager, Strategist, Designer, Front End Developer, and Back End Developer. These titles represent the key stakeholders or team members who play a crucial role in the successful completion of the project.
Each cell within the table represents a unique intersection of a project deliverable and a role. The values within the cells correspond to the responsibilities of each person. The RACI acronym is used to define these responsibilities:
- * Consulted: Individuals who are sought out for their expertise or input regarding a specific deliverable or activity. They provide valuable insights and recommendations.
- * Responsible: The person or role that is accountable for executing or completing a particular deliverable or activity. They take ownership and ensure that the task is fulfilled.
- * Accountable: The ultimate decision-maker or approver who is answerable for the successful outcome of a project deliverable or activity. They have the authority to make final decisions and ensure accountability.
- * Informed: Individuals who need to be kept informed about the progress, updates, or decisions regarding a specific deliverable or activity. They may not have direct involvement but should stay informed about the project's developments.
This template provides a visual representation of the RACI Chart, allowing teams to clearly understand their roles, responsibilities, and overall project structure. It facilitates effective communication, mitigates confusion, and fosters collaboration among team members.
The Example RACI Chart presentation template can be utilized by a wide range of professionals, including project managers, team leaders, business consultants, and stakeholders involved in project planning and execution. It is particularly useful during project kick-off meetings, team updates, and stakeholder presentations, where clarifying roles and responsibilities is critical to project success.