111577
KPI Infographic Google Slide Design Template - Tema de Google Slides
ID: 11452
Desbloquea este archivo y accede sin límite de recursos Premium
¡Hazte Premium y descargar! | ¿Ya Premium? Acceder
Desbloquea este archivo y accede sin límite de recursos Premium
¡Hazte Premium y descargar! | ¿Ya Premium? Acceder
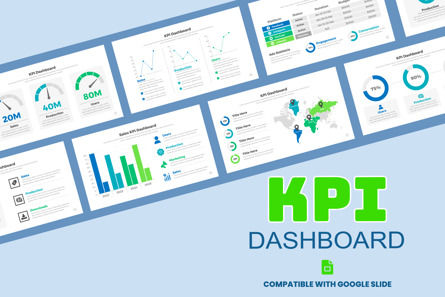
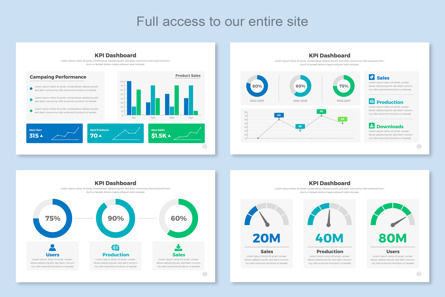
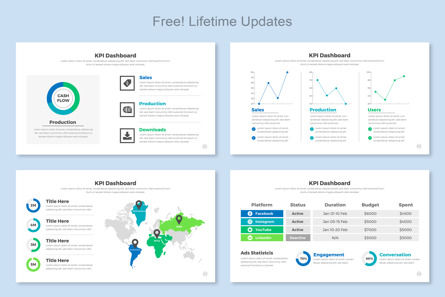
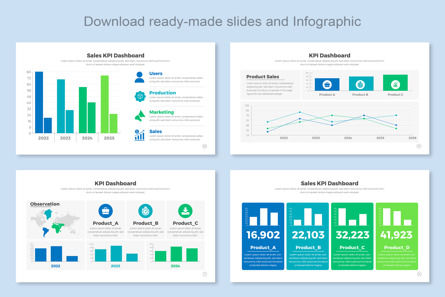
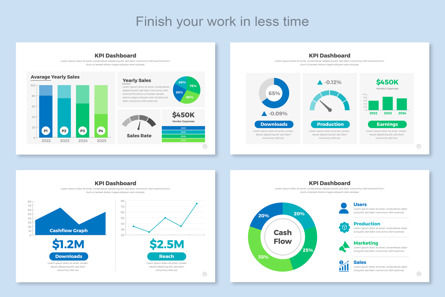
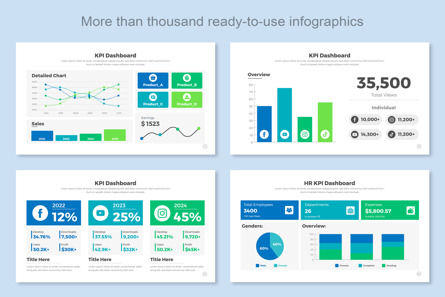
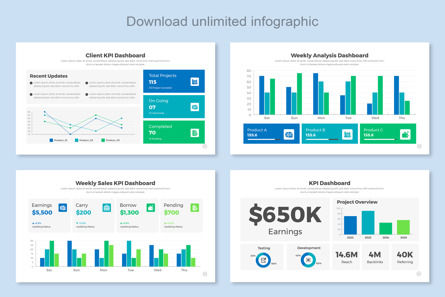
Introducing our comprehensive KPI Infographic Set, designed to help businesses effectively track and communicate their key performance indicators. This extensive collection of visually stunning infographics provides a powerful tool for presenting complex data in a clear and engaging manner. Whether you're preparing a boardroom presentation, creating reports, or enhancing your marketing materials, our KPI Infographic Set will empower you to convey your organization's progress and success metrics with impact.
Each infographic in this set is meticulously crafted to showcase KPIs across various industries, including finance, marketing, sales, operations, and more. With their sleek designs, intuitive layouts, and visually appealing charts and graphs, these infographics enable you to highlight key insights and trends in a visually compelling way. Impress your audience, whether it's stakeholders, clients, or colleagues, by effectively communicating your organization's performance measures.
▶ F E A T U R E
================
✔ Instant Download – your files are available immediately after purchase
✔ Professional, clean design
✔ Easy to edit in Google Slide File
✔ 100% Editable
✔ Using a free font
▶ W H A T ' S I N S I D E
===========================
✔ Google Slide File
✔ Help File Documentation
✔ Links to free fonts used
✔ Fast and friendly customer service for any help you may need
▶ S U P P O R T
================
For any help regarding this file, please feel free to contact me and I’ll be glad to offer support. If you have a moment, please rate this item, I’ll appreciate it very much! Please don’t underestimate the power of the stars.
THANK YOU. Más...
Ítem relacionados
Ocurrió un error
Algo salió mal. Eso es todo lo que sabemos por el momento.
Por favor, actualiza la página e inténtalo de nuevo. Si el problema persiste, espera 30-40 minutos antes de intentarlo nuevamente. Agradecemos tu paciencia.

